The Web UI tour
The Web UI is the same dashboard as the TUI, in your browser
and updated live as runs happen. It lives inside the daemon
binary — no separate web server, no CDN, no extra port. Go to
http://<host>:<port> (default http://localhost:9477) and you’re
there.
The dashboard is small and mostly read-only. The only things that
actually change anything are trigger, restart, and stop — the rest
is just looking, because runwisp.toml stays the source of truth.
Open from the TUI
Section titled “Open from the TUI”If you’re already in the local TUI (just type runwisp), the Open
Web UI row on the Home page is the easiest way in:
runwispstarts the daemon and opens the TUI.- The Home page lists
▸ ⮕ Open Web UIas its first row. - Press
Enterand your browser opens the dashboard, already logged in — no need to paste the password.
Behind the scenes, the TUI mints a single-use launch ticket and hands it to the browser, so your password never travels through the URL.
On a server with no browser, the TUI prints the URL instead, so you can paste it on another machine.
Open from a browser
Section titled “Open from a browser”When you don’t have the local TUI — a remote browser, a coworker’s laptop, a cold bookmark — you’ll see the login modal.
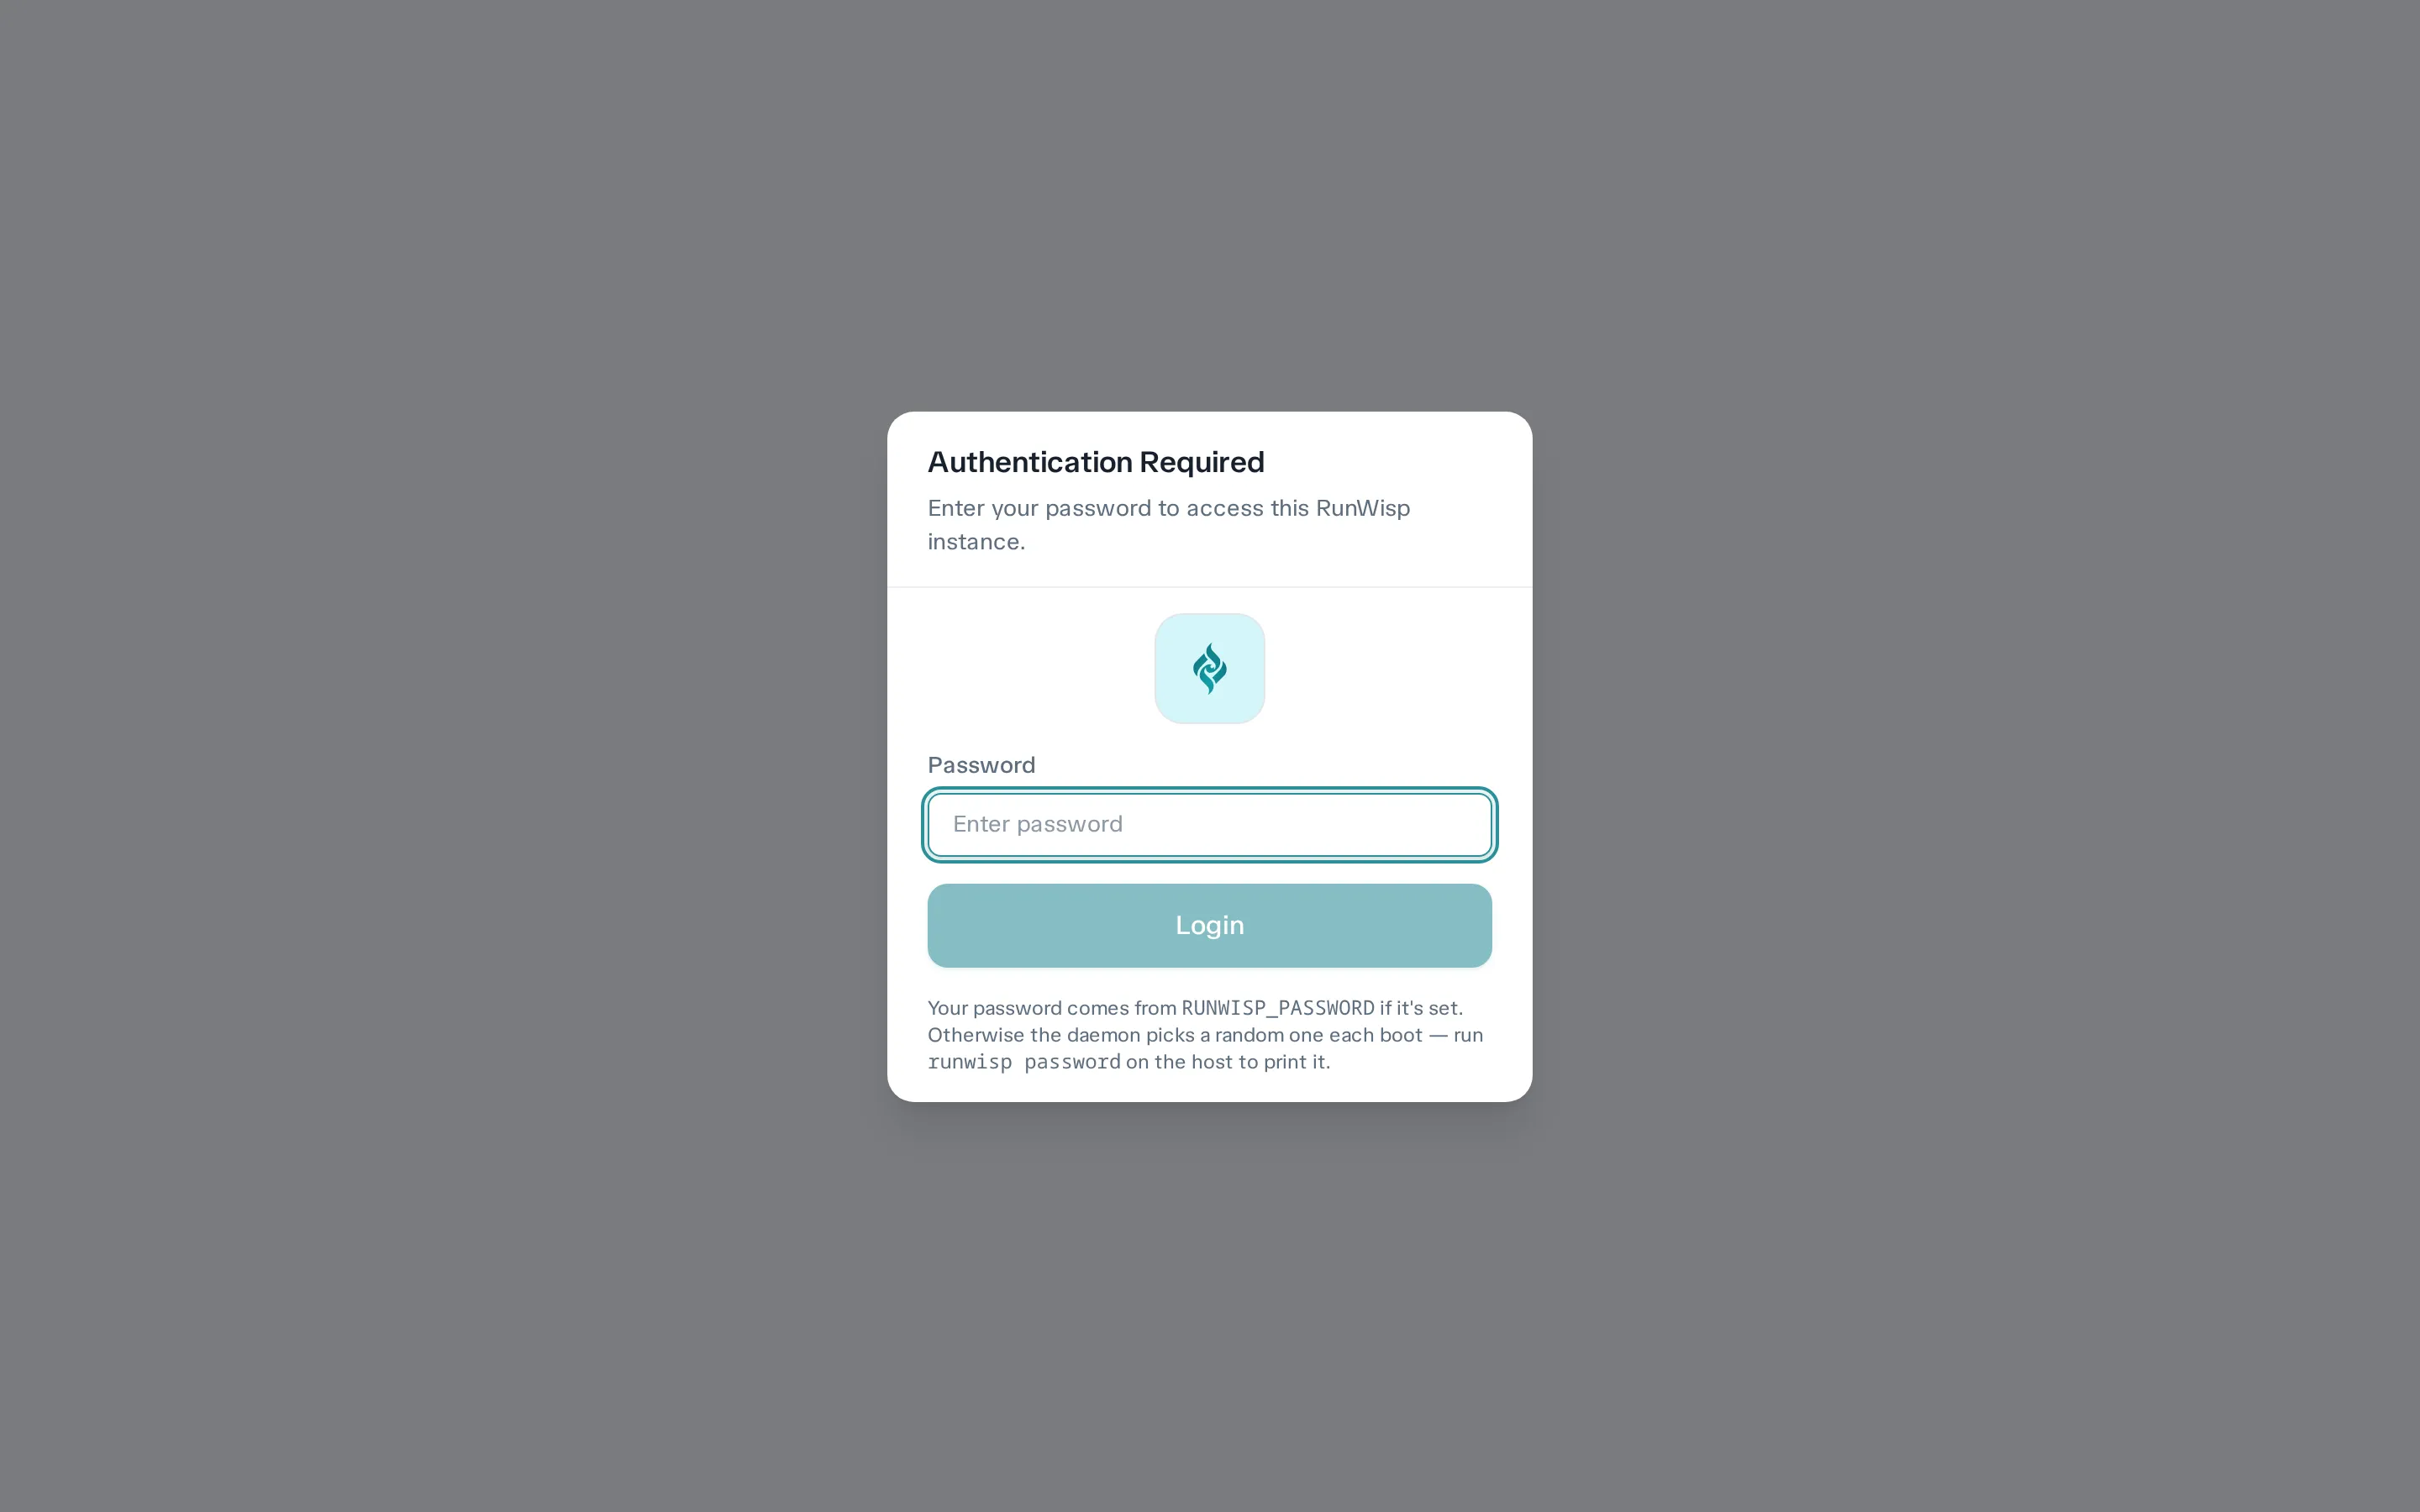
There’s no username — RunWisp is single-operator. Type the password and submit. The password never goes over the network: login uses a challenge-response handshake. For details, see Auth.
Your session expires after a while, and then you just log in again. Pile up too many wrong password attempts and you’ll hit a temporary lockout — wait it out or restart the daemon. Auth has the exact limits.
Overview (/)
Section titled “Overview (/)”The landing page after login.
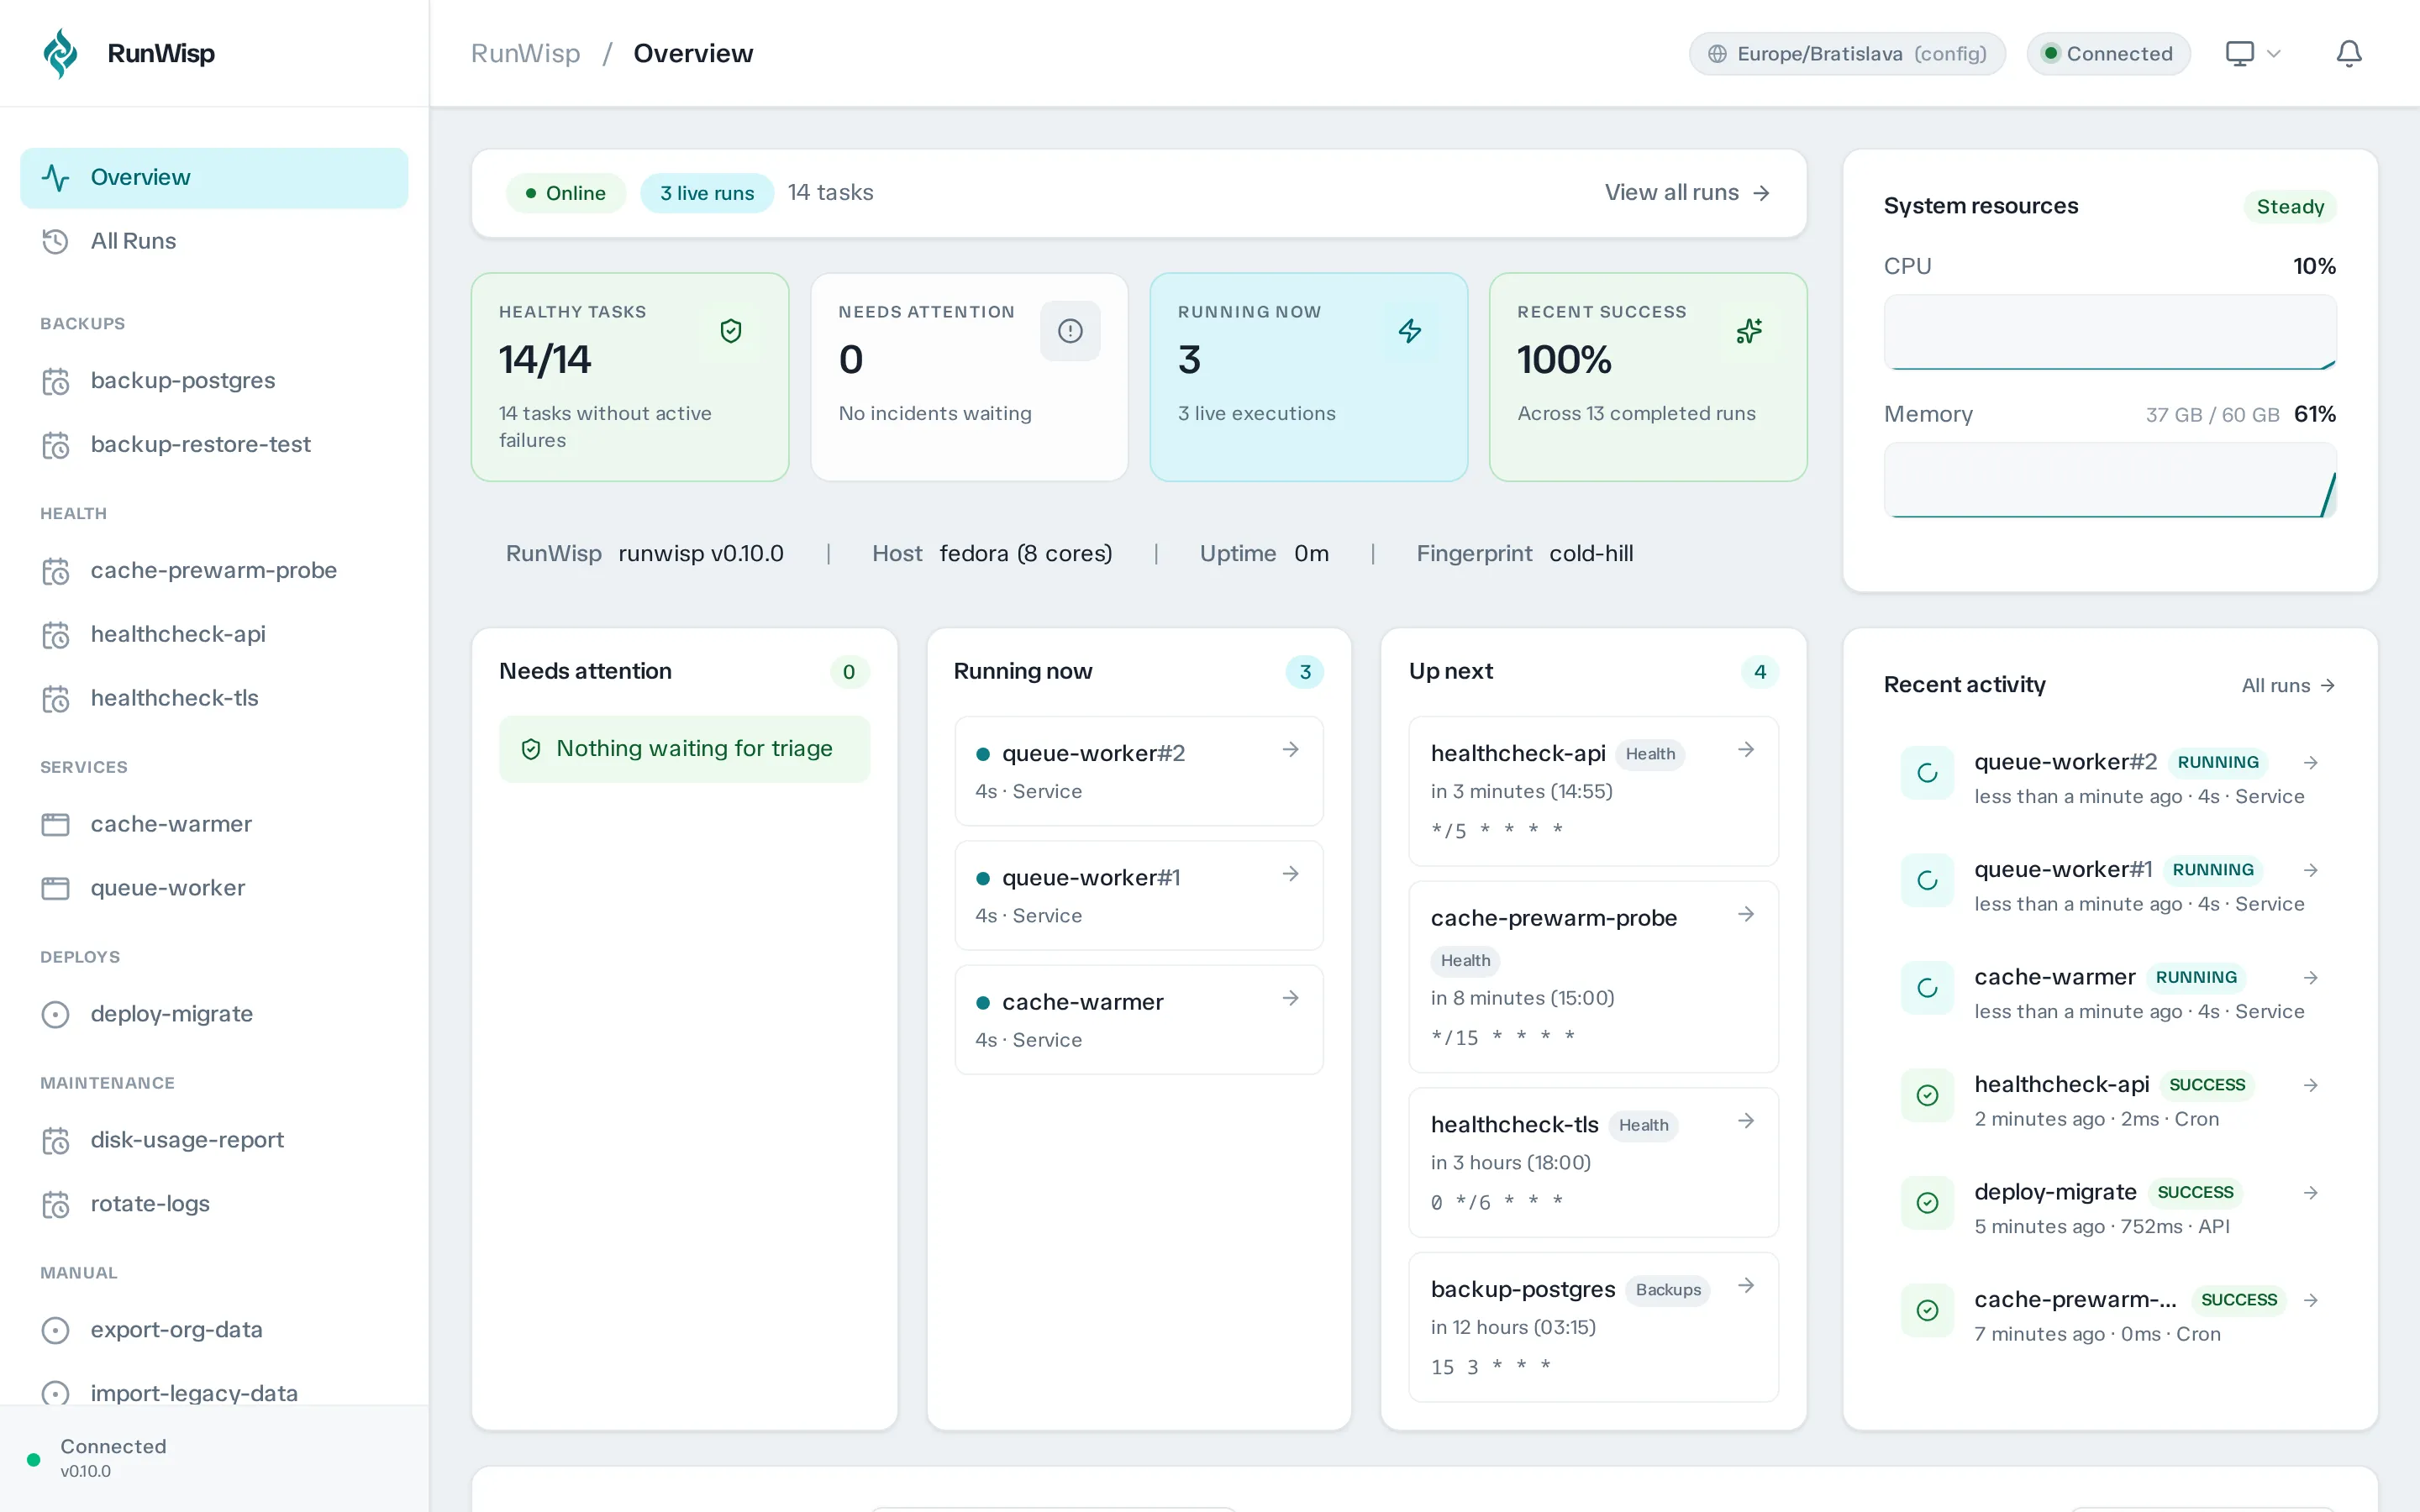
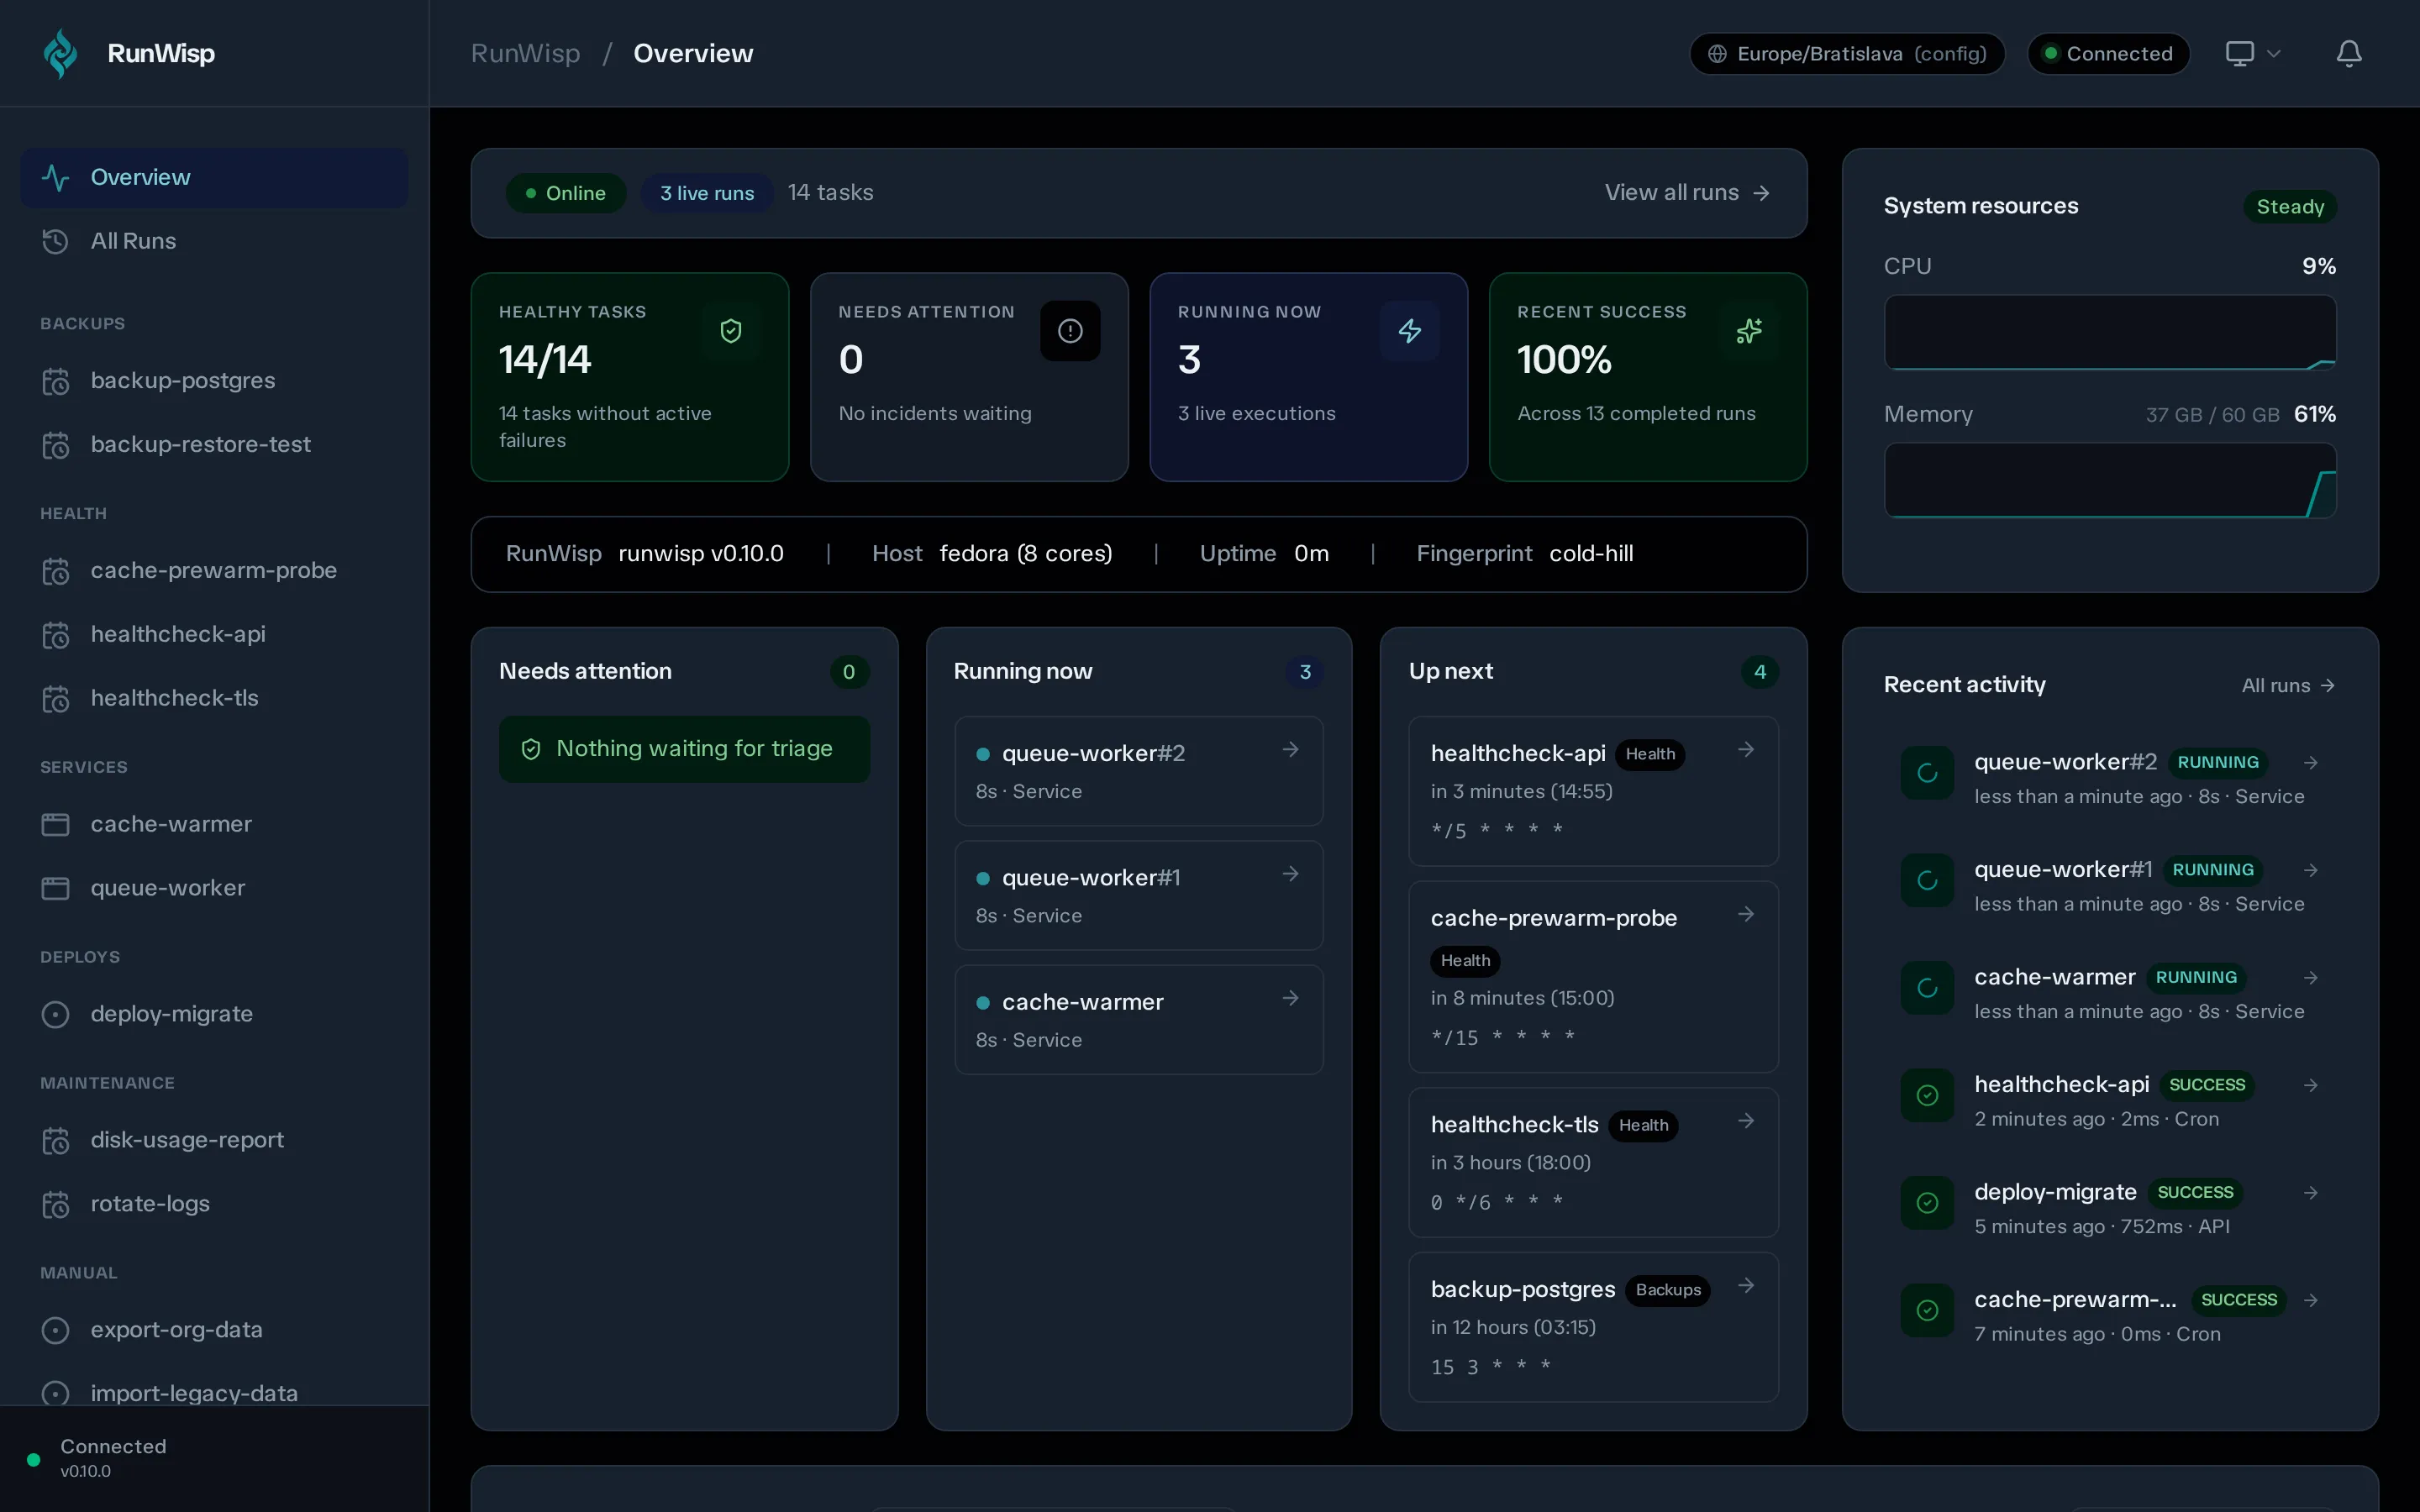
- Daemon header — a fact bar showing RunWisp name and version, host and CPU count, uptime, and the instance fingerprint.
- Stats — four summary cards: Healthy tasks, Needs attention, Running now, and Recent success rate. CPU and memory show up in a separate System resources panel with live sparklines.
- Task overview — filter tabs (All · Attention · Running · Scheduled · Manual) with a sort selector, so you see the part you care about without scrolling.
- Recent activity — the most recent runs across all tasks, updated live. Next to it, three side panels (Needs attention, Running now, Up next).
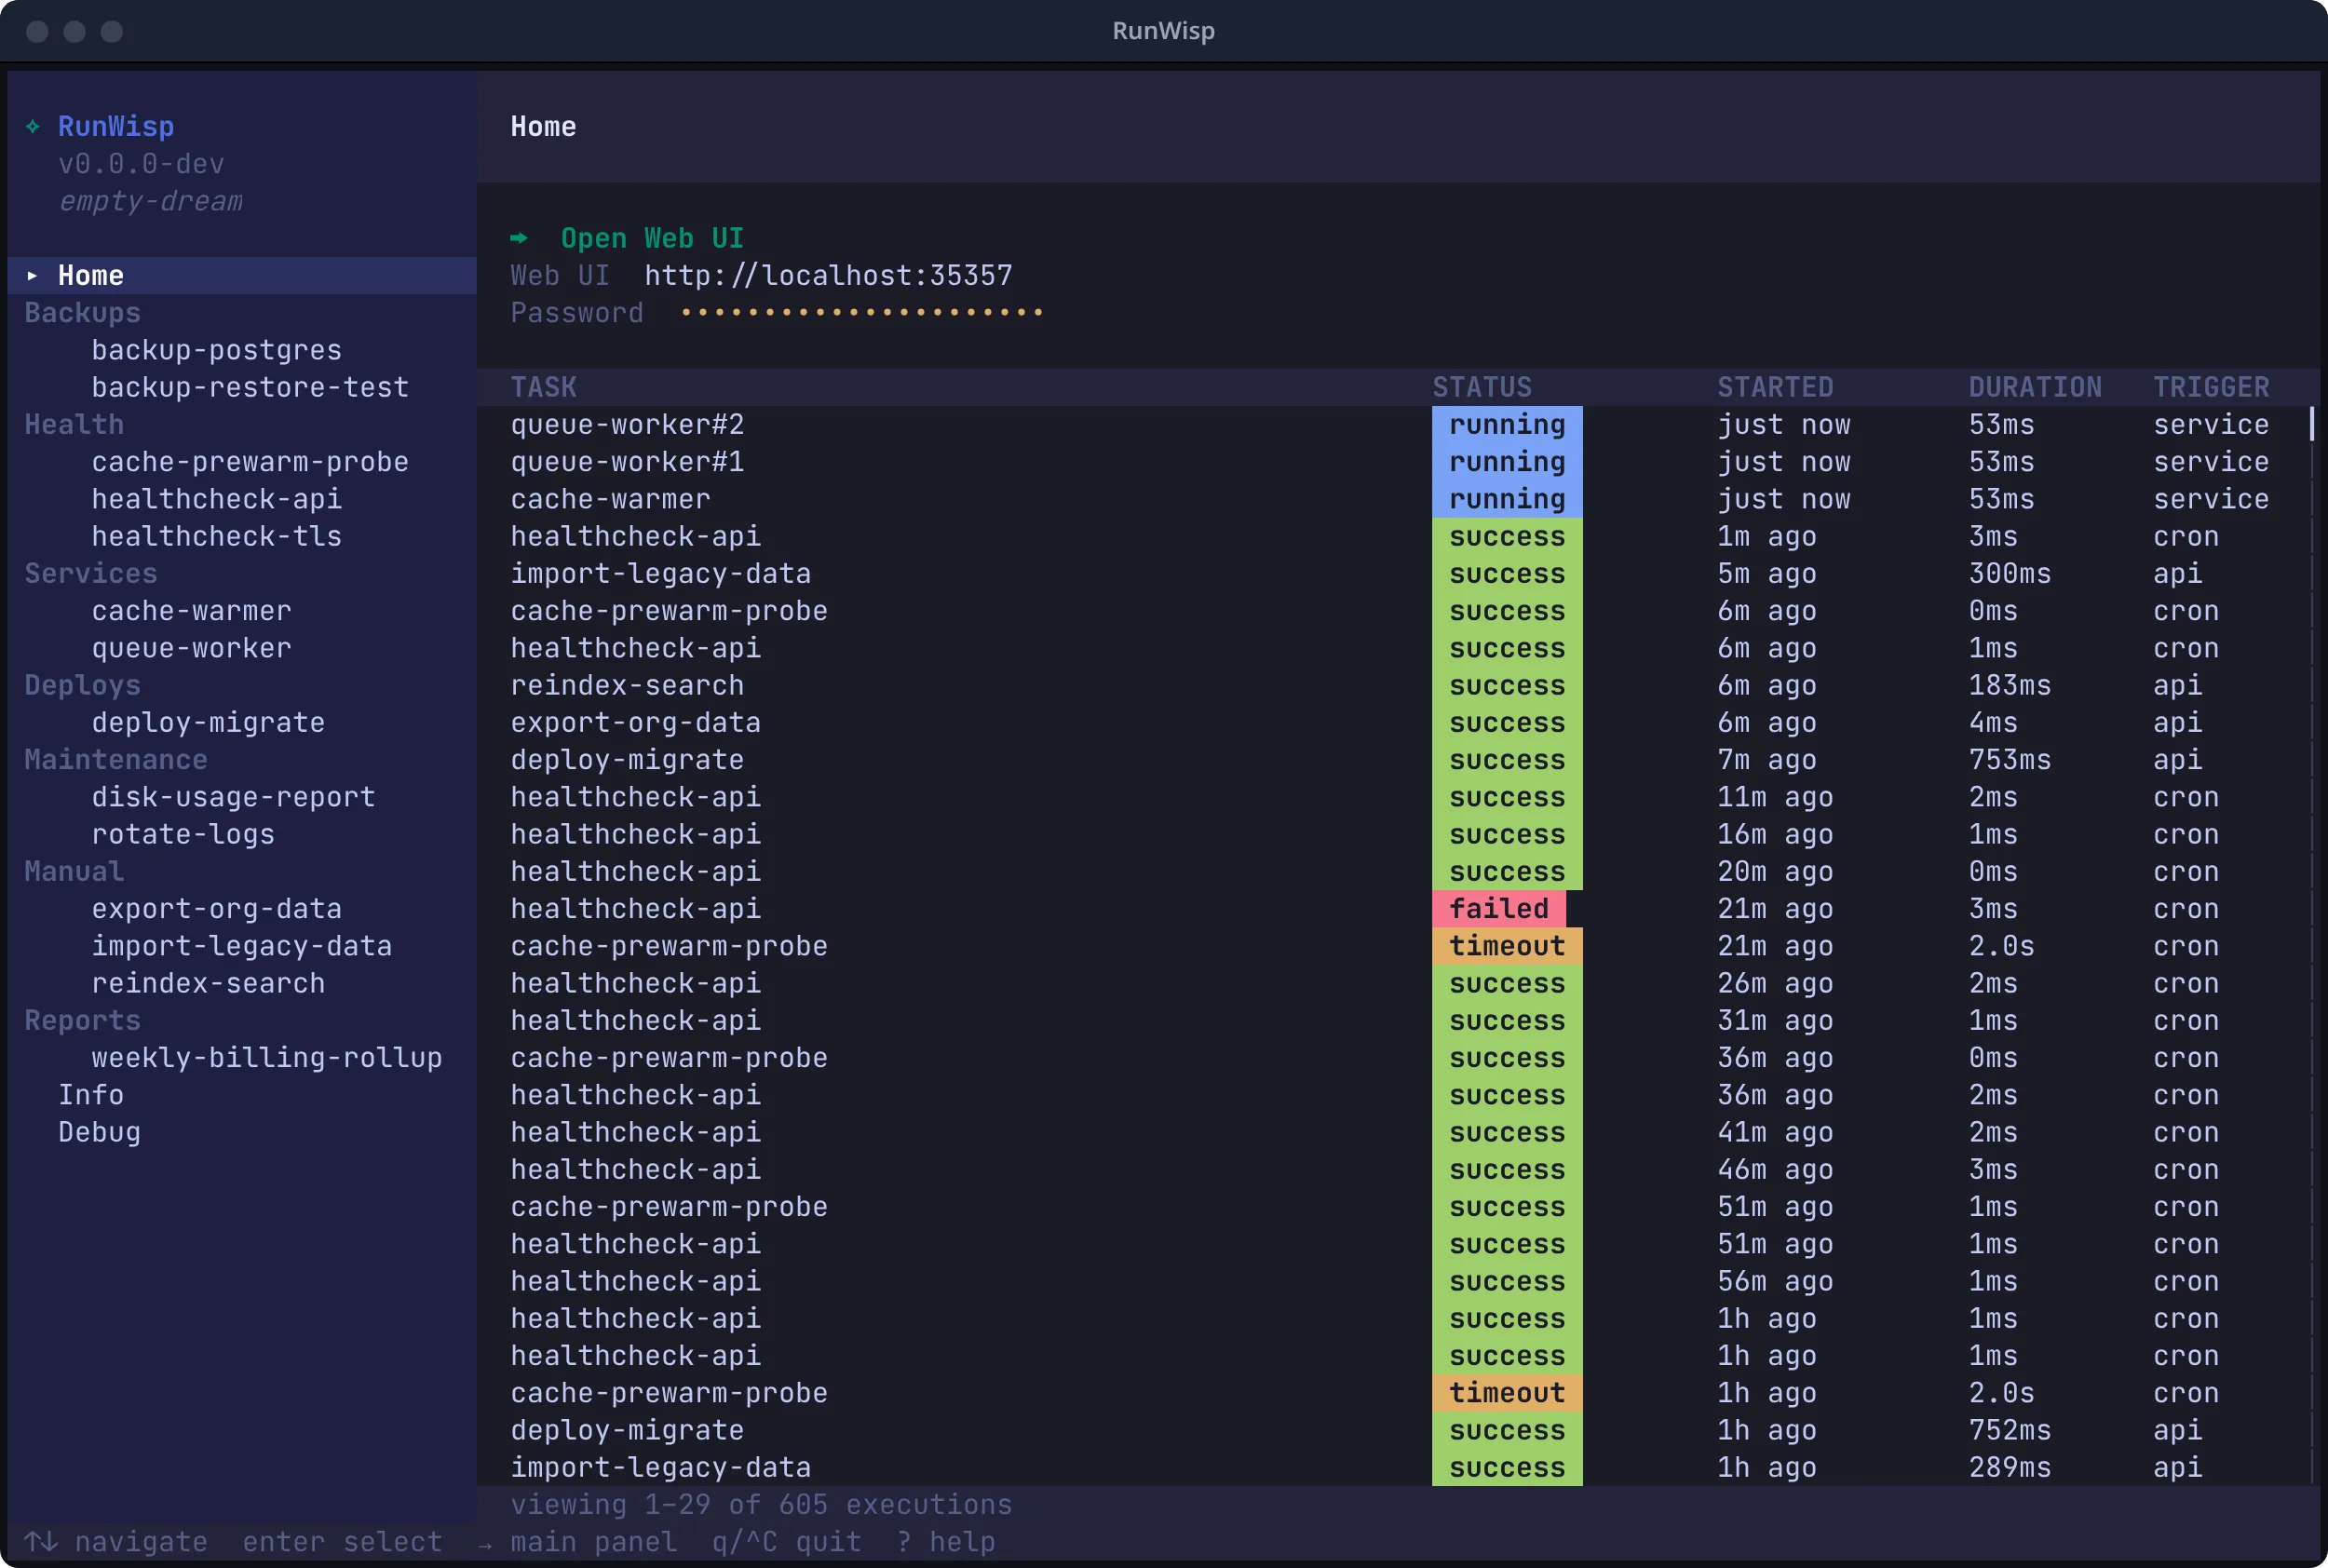
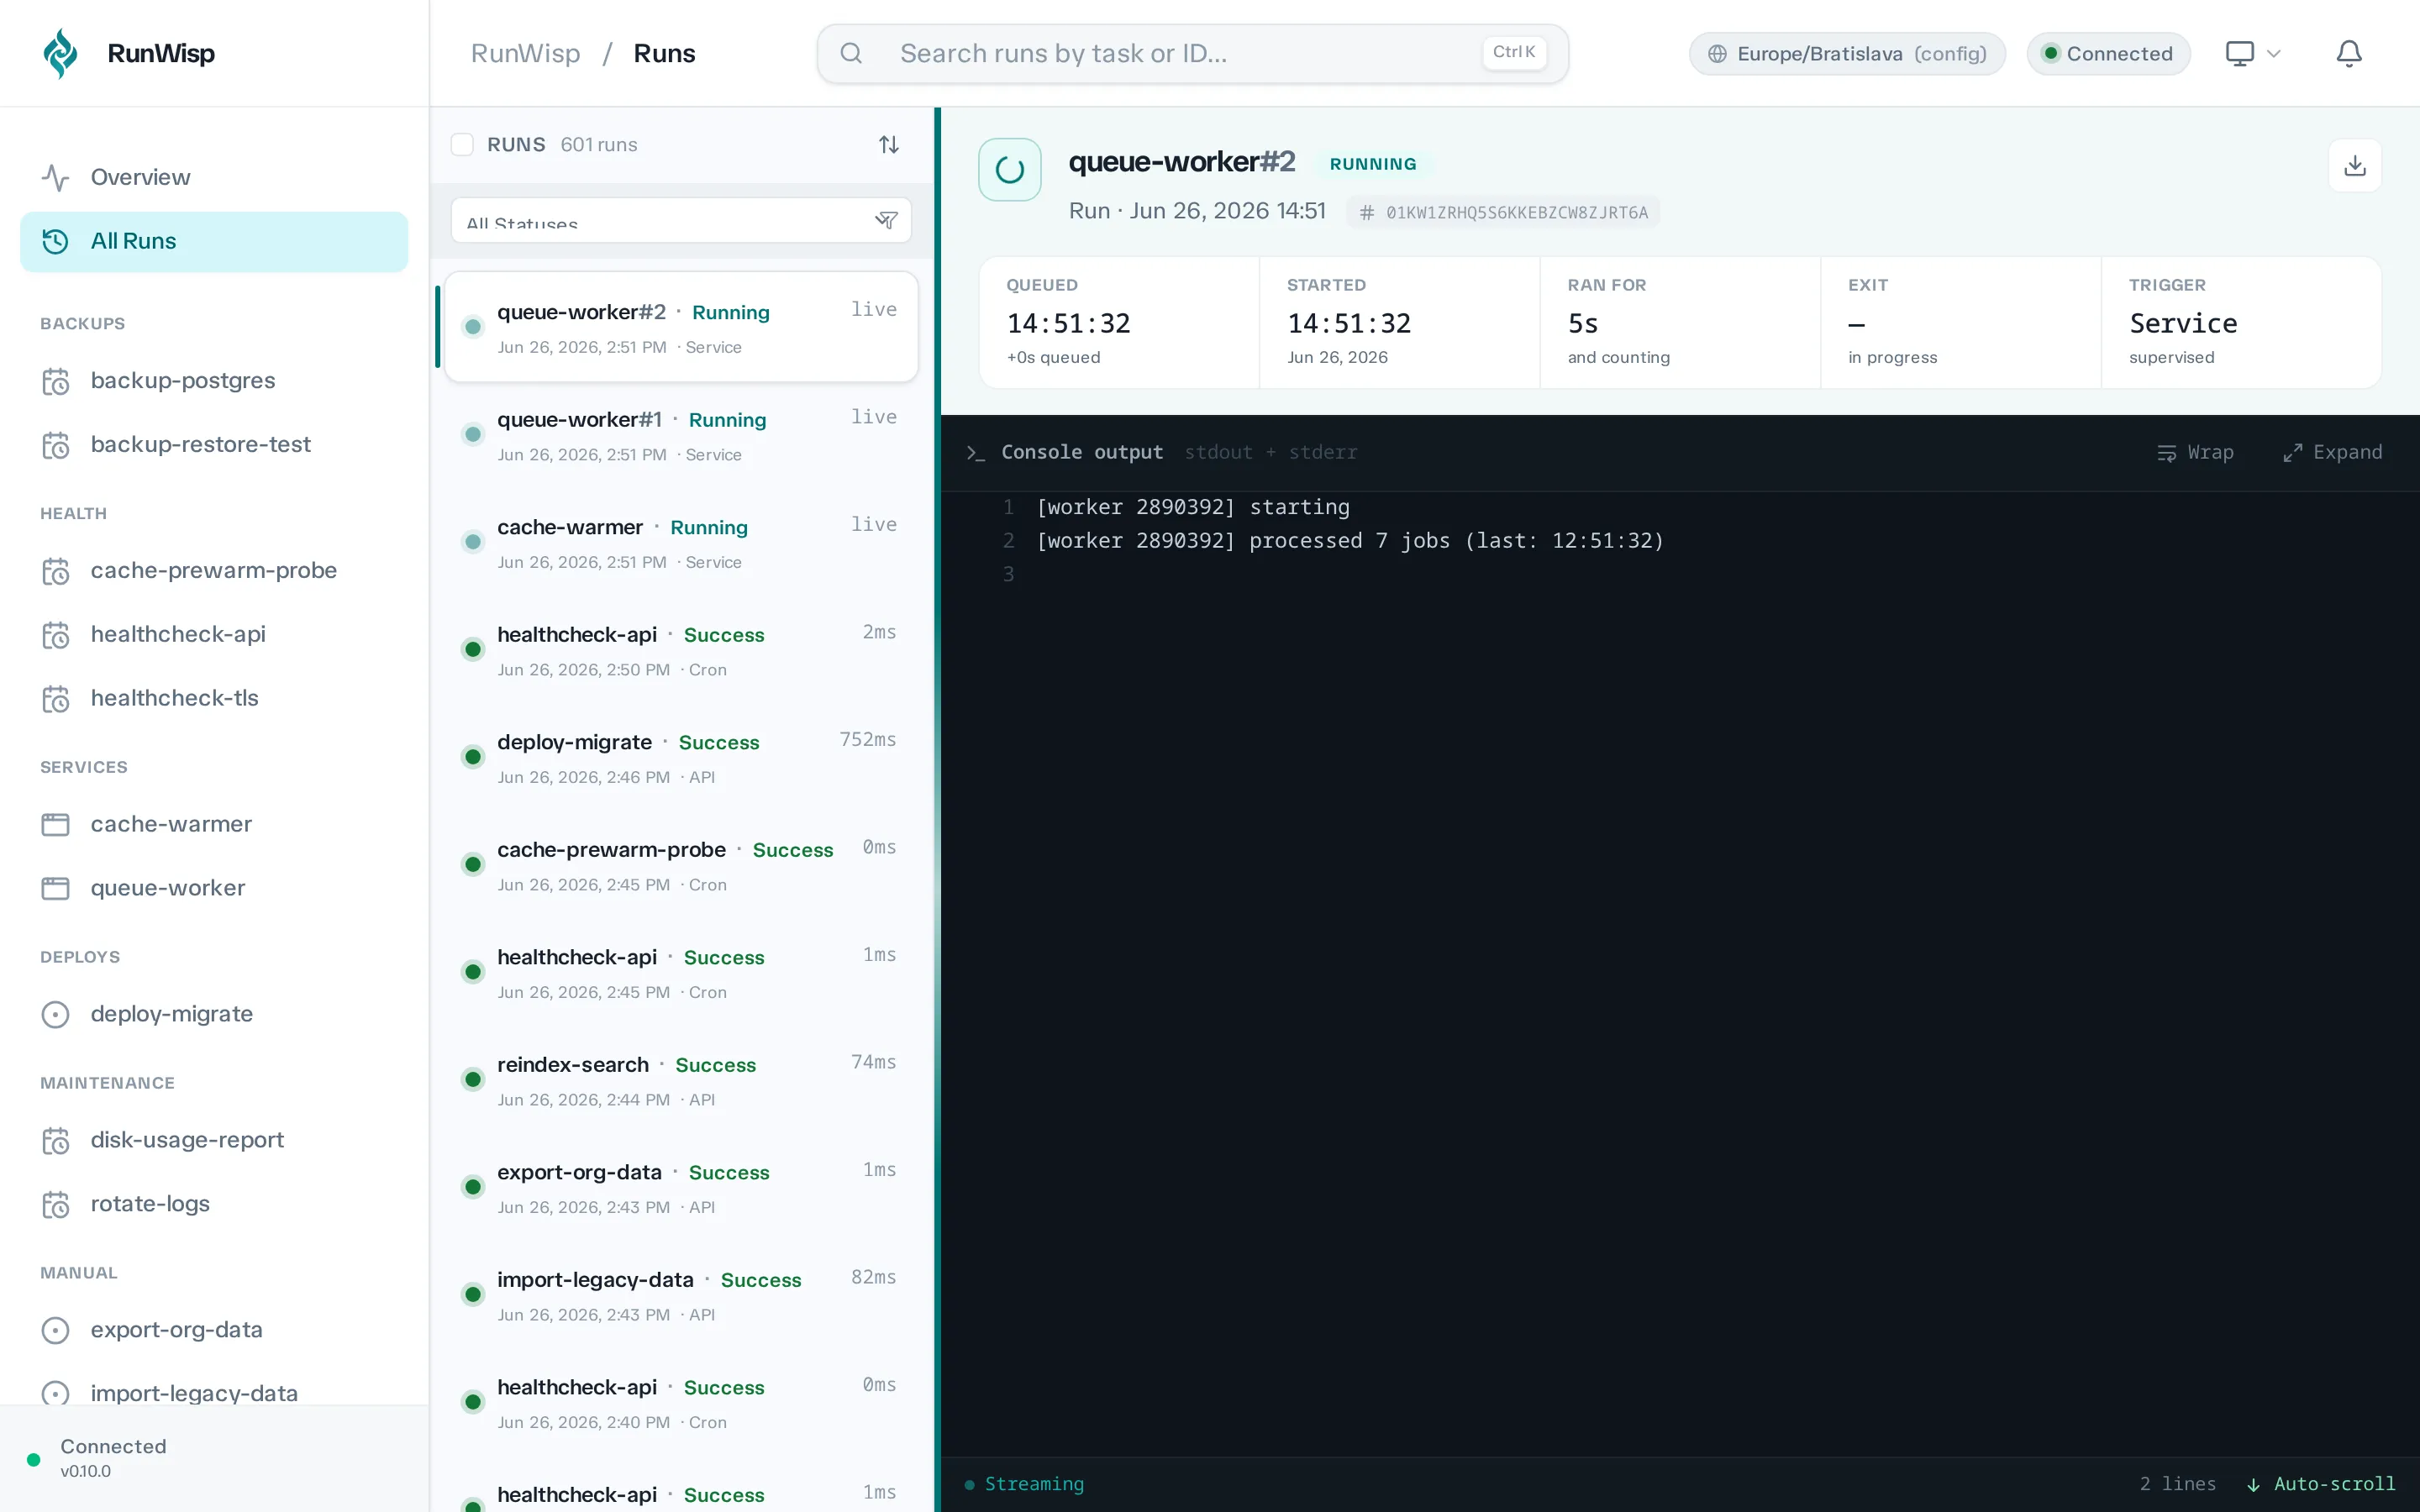
All runs (/runs)
Section titled “All runs (/runs)”A flat, newest-first list of recent runs across every task. This is the page for “what’s been going on lately” when you don’t yet know which task to dig into.
Filtering
Section titled “Filtering”The list can get long, so there’s a Filter button in the run-history header. It opens a roomy popover over the run detail — so the list you’re filtering stays put and updates live as you tweak it — and on a phone it slides up as a full-width sheet instead. A badge on the button counts how many filters are active, and whatever you pick shows up as removable chips under the header, so you can always see (and clear) what’s narrowing the list.
The filters, roughly in the order you’ll reach for them:
- Status — five plain-language buckets: Running, Succeeded,
Failed, Skipped, and Stopped. Tick Failed to catch
everything that broke or went missing — the one-click answer to “did
anything fail?”. Need to be surgical (say, only
timeout)? Open Advanced to pick the exact statuses. - Date range — an independent From / To pair. Set just one end and it stays open the other way — a From with no To means “everything since”, and picking the same day for both captures that whole day. A bare date counts from its 00:00 (From) or through its end (To), so a To of 10 July includes everything that ran that day.
- Task — narrow to a single task (only on
/runs; a task’s own page is already scoped to it). - Triggered by — scheduled (cron), manual (UI or API), a service auto-start, or a run on daemon start.
- Exit code — a small expression: an exact code (
137, handy for hunting an OOM), a comparison (>100,<=2), or a window built from both (>100 <150). It resolves to an inclusive range. - Retries — only runs that were a retry of an earlier attempt.
Everything filters server-side, so the count and “load more” stay
honest no matter how many runs you have. The same filters back the
bulk actions (re-run / cancel / delete) — select-all-matching
operates on exactly the rows your filter shows. Over the REST API the
identical knobs are query parameters on
GET /api/runs (status, created_after, created_before,
triggered_by, exit_code_min, exit_code_max, retries_only).
Task detail (/tasks/{id})
Section titled “Task detail (/tasks/{id})”Click a task in the sidebar (or any run in the activity feed) to open its detail page. The header names the task and shows its description; next to it sits the page’s one action button — Run Task for a task, Stop while a run is active, or for a service Stop Service (or Restart Service if the service is currently stopped).
If the task declares parameters,
clicking Run Task opens a form — each declared input renders as a
text field, dropdown, or toggle, with validation and descriptions right
there. Fill in what you need and submit. Tasks with no params trigger
instantly with no form.
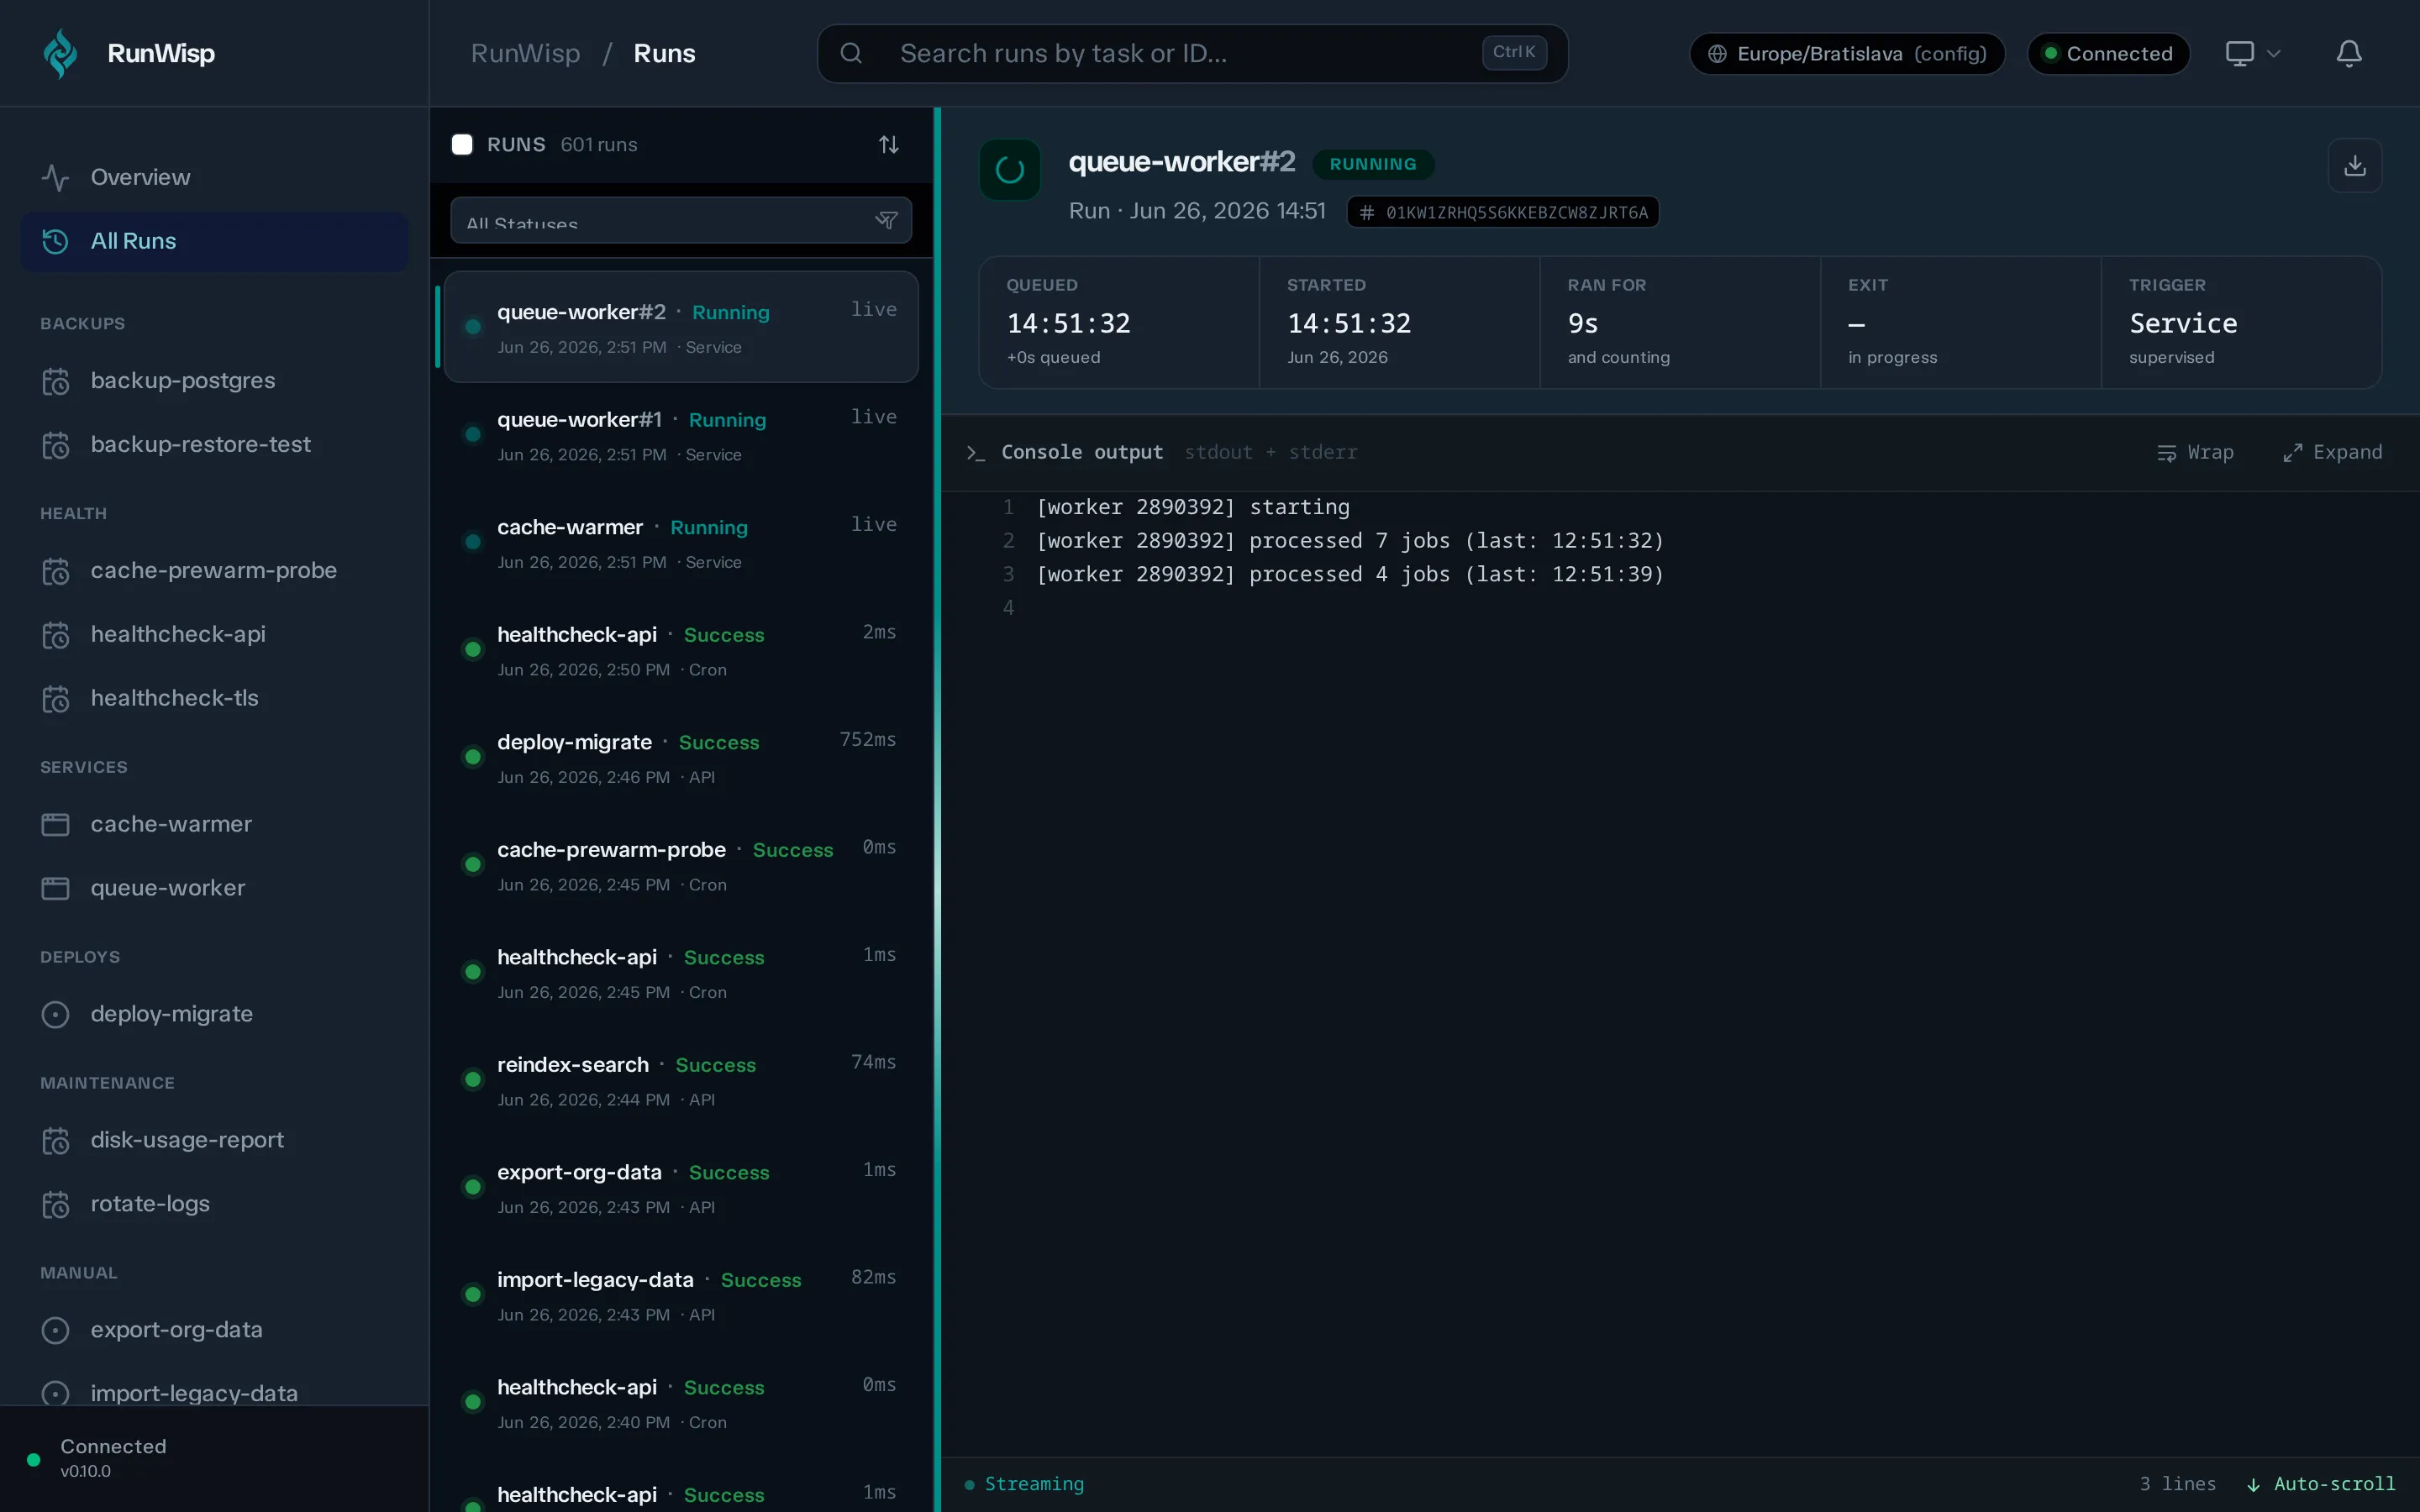
Underneath the header you’ll find the run history for this task and, taking up most of the pane, the log for whichever run you have selected. New lines stream in live while the run is going.
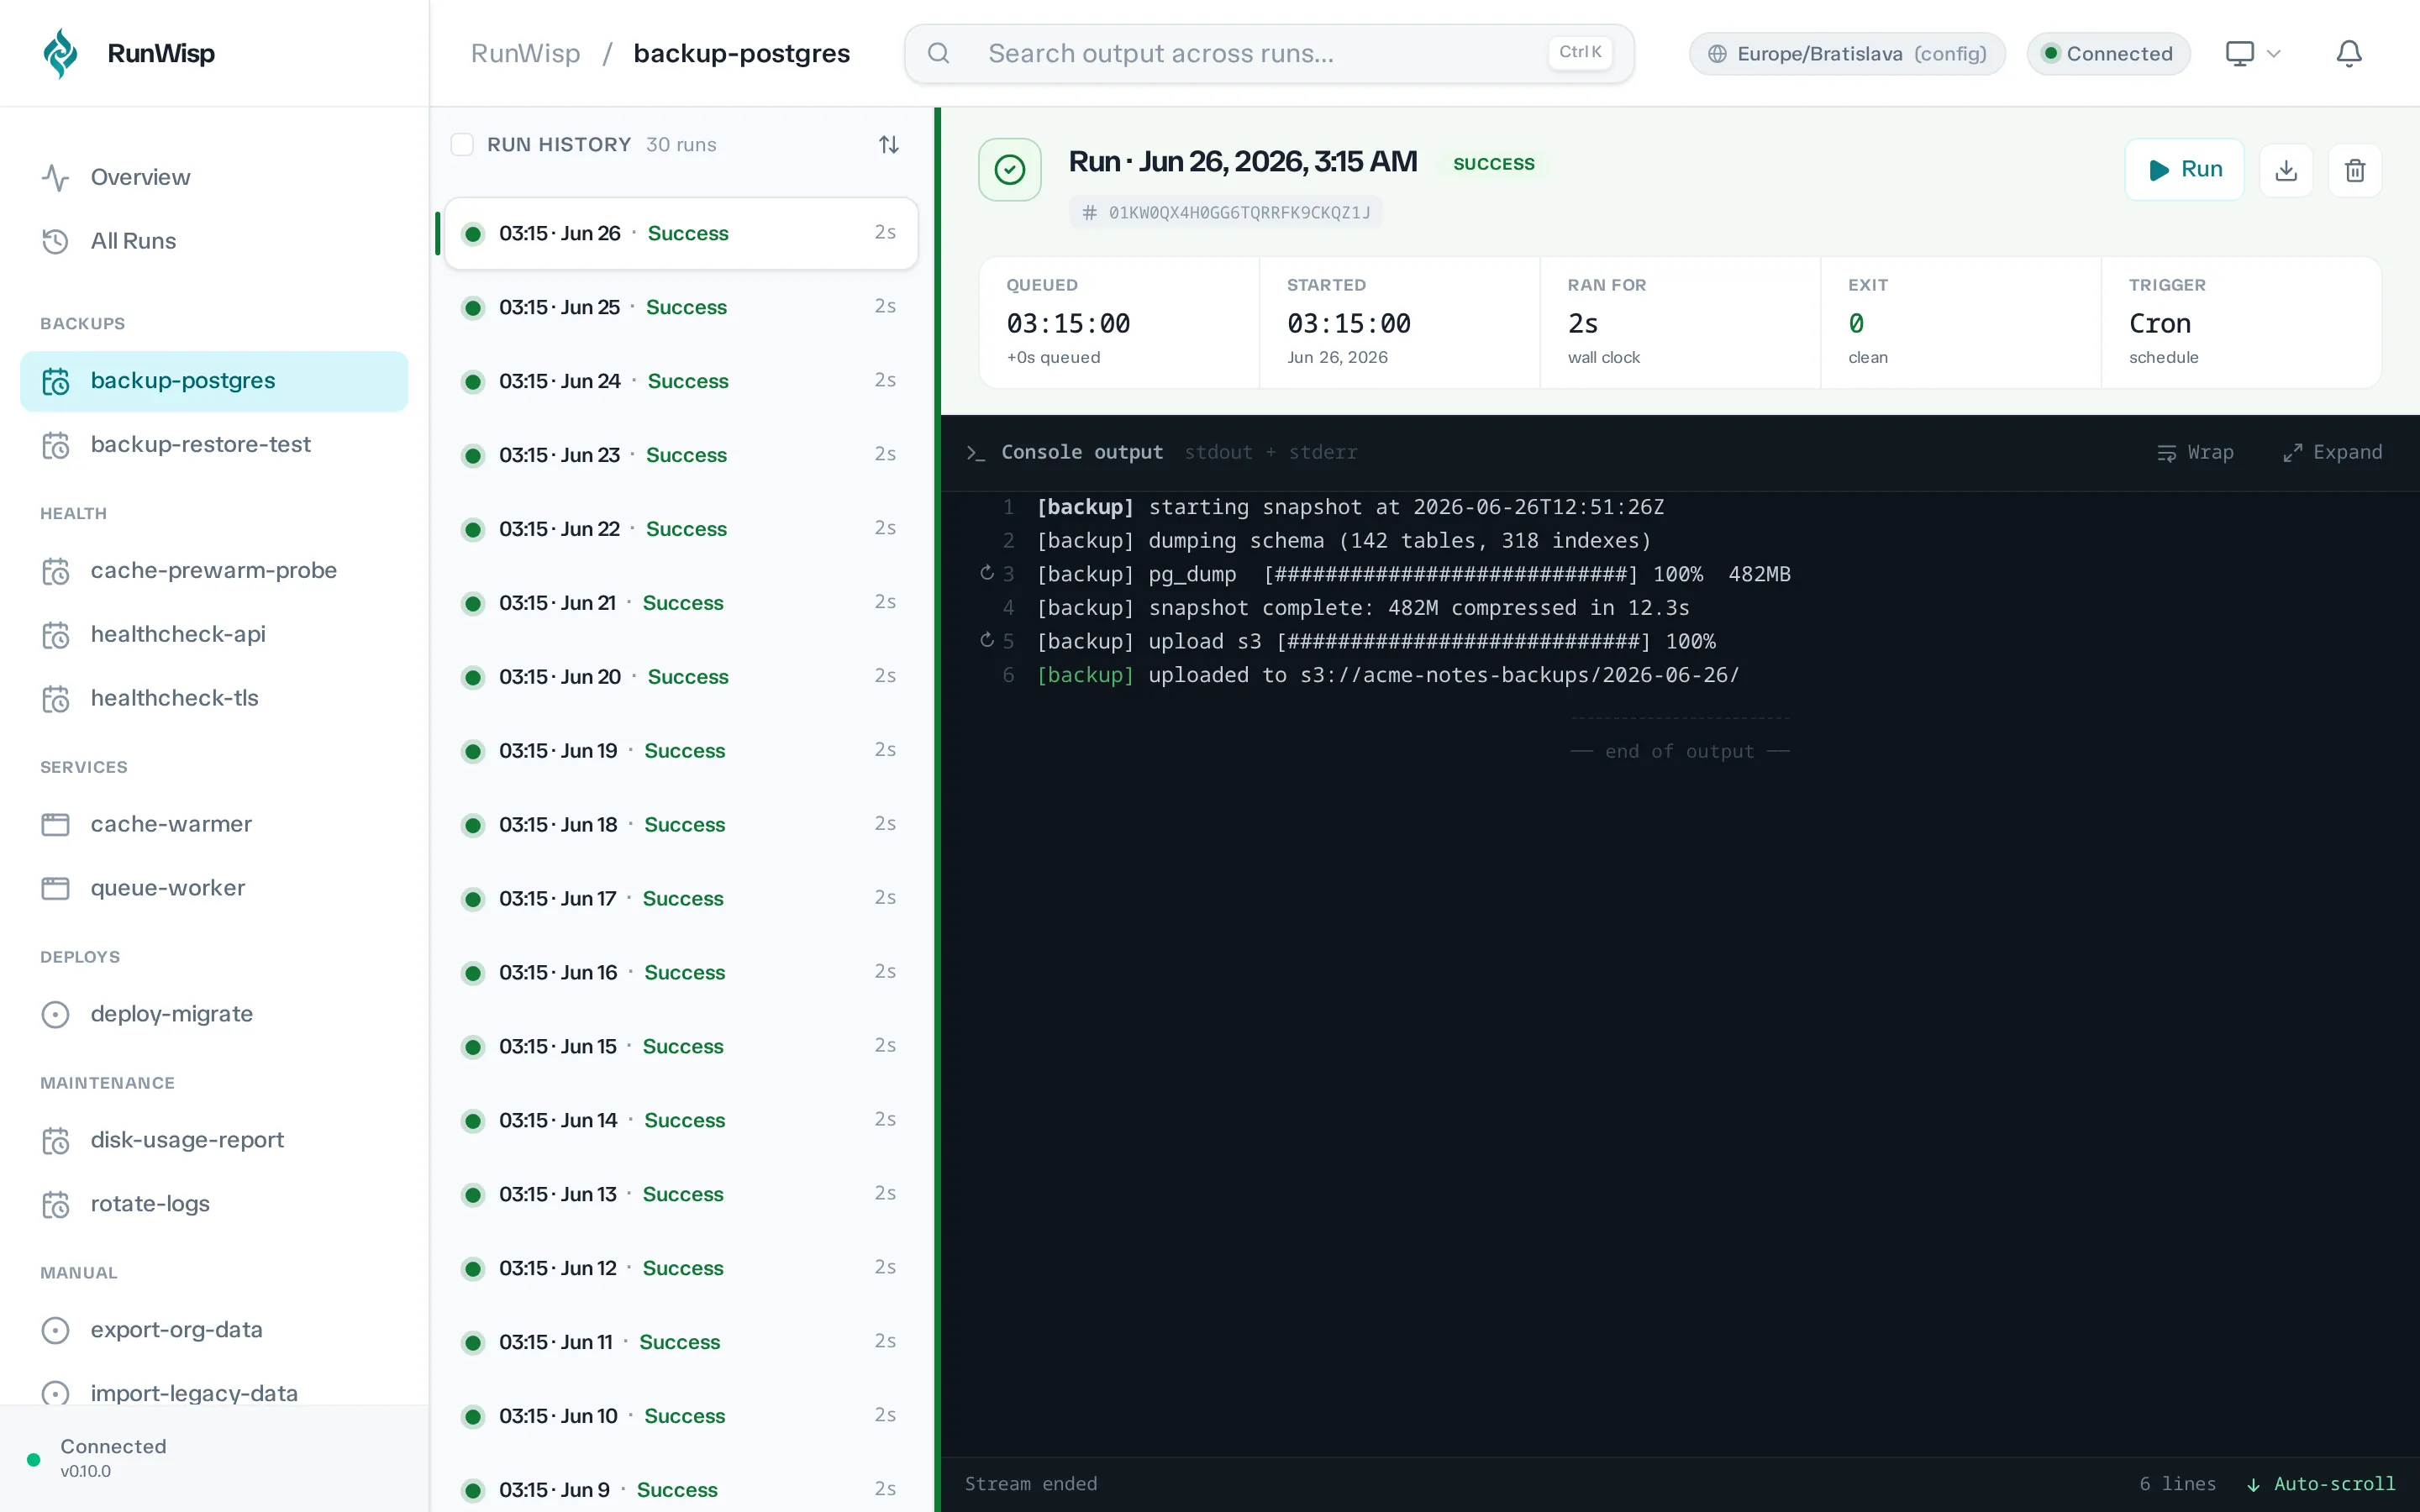
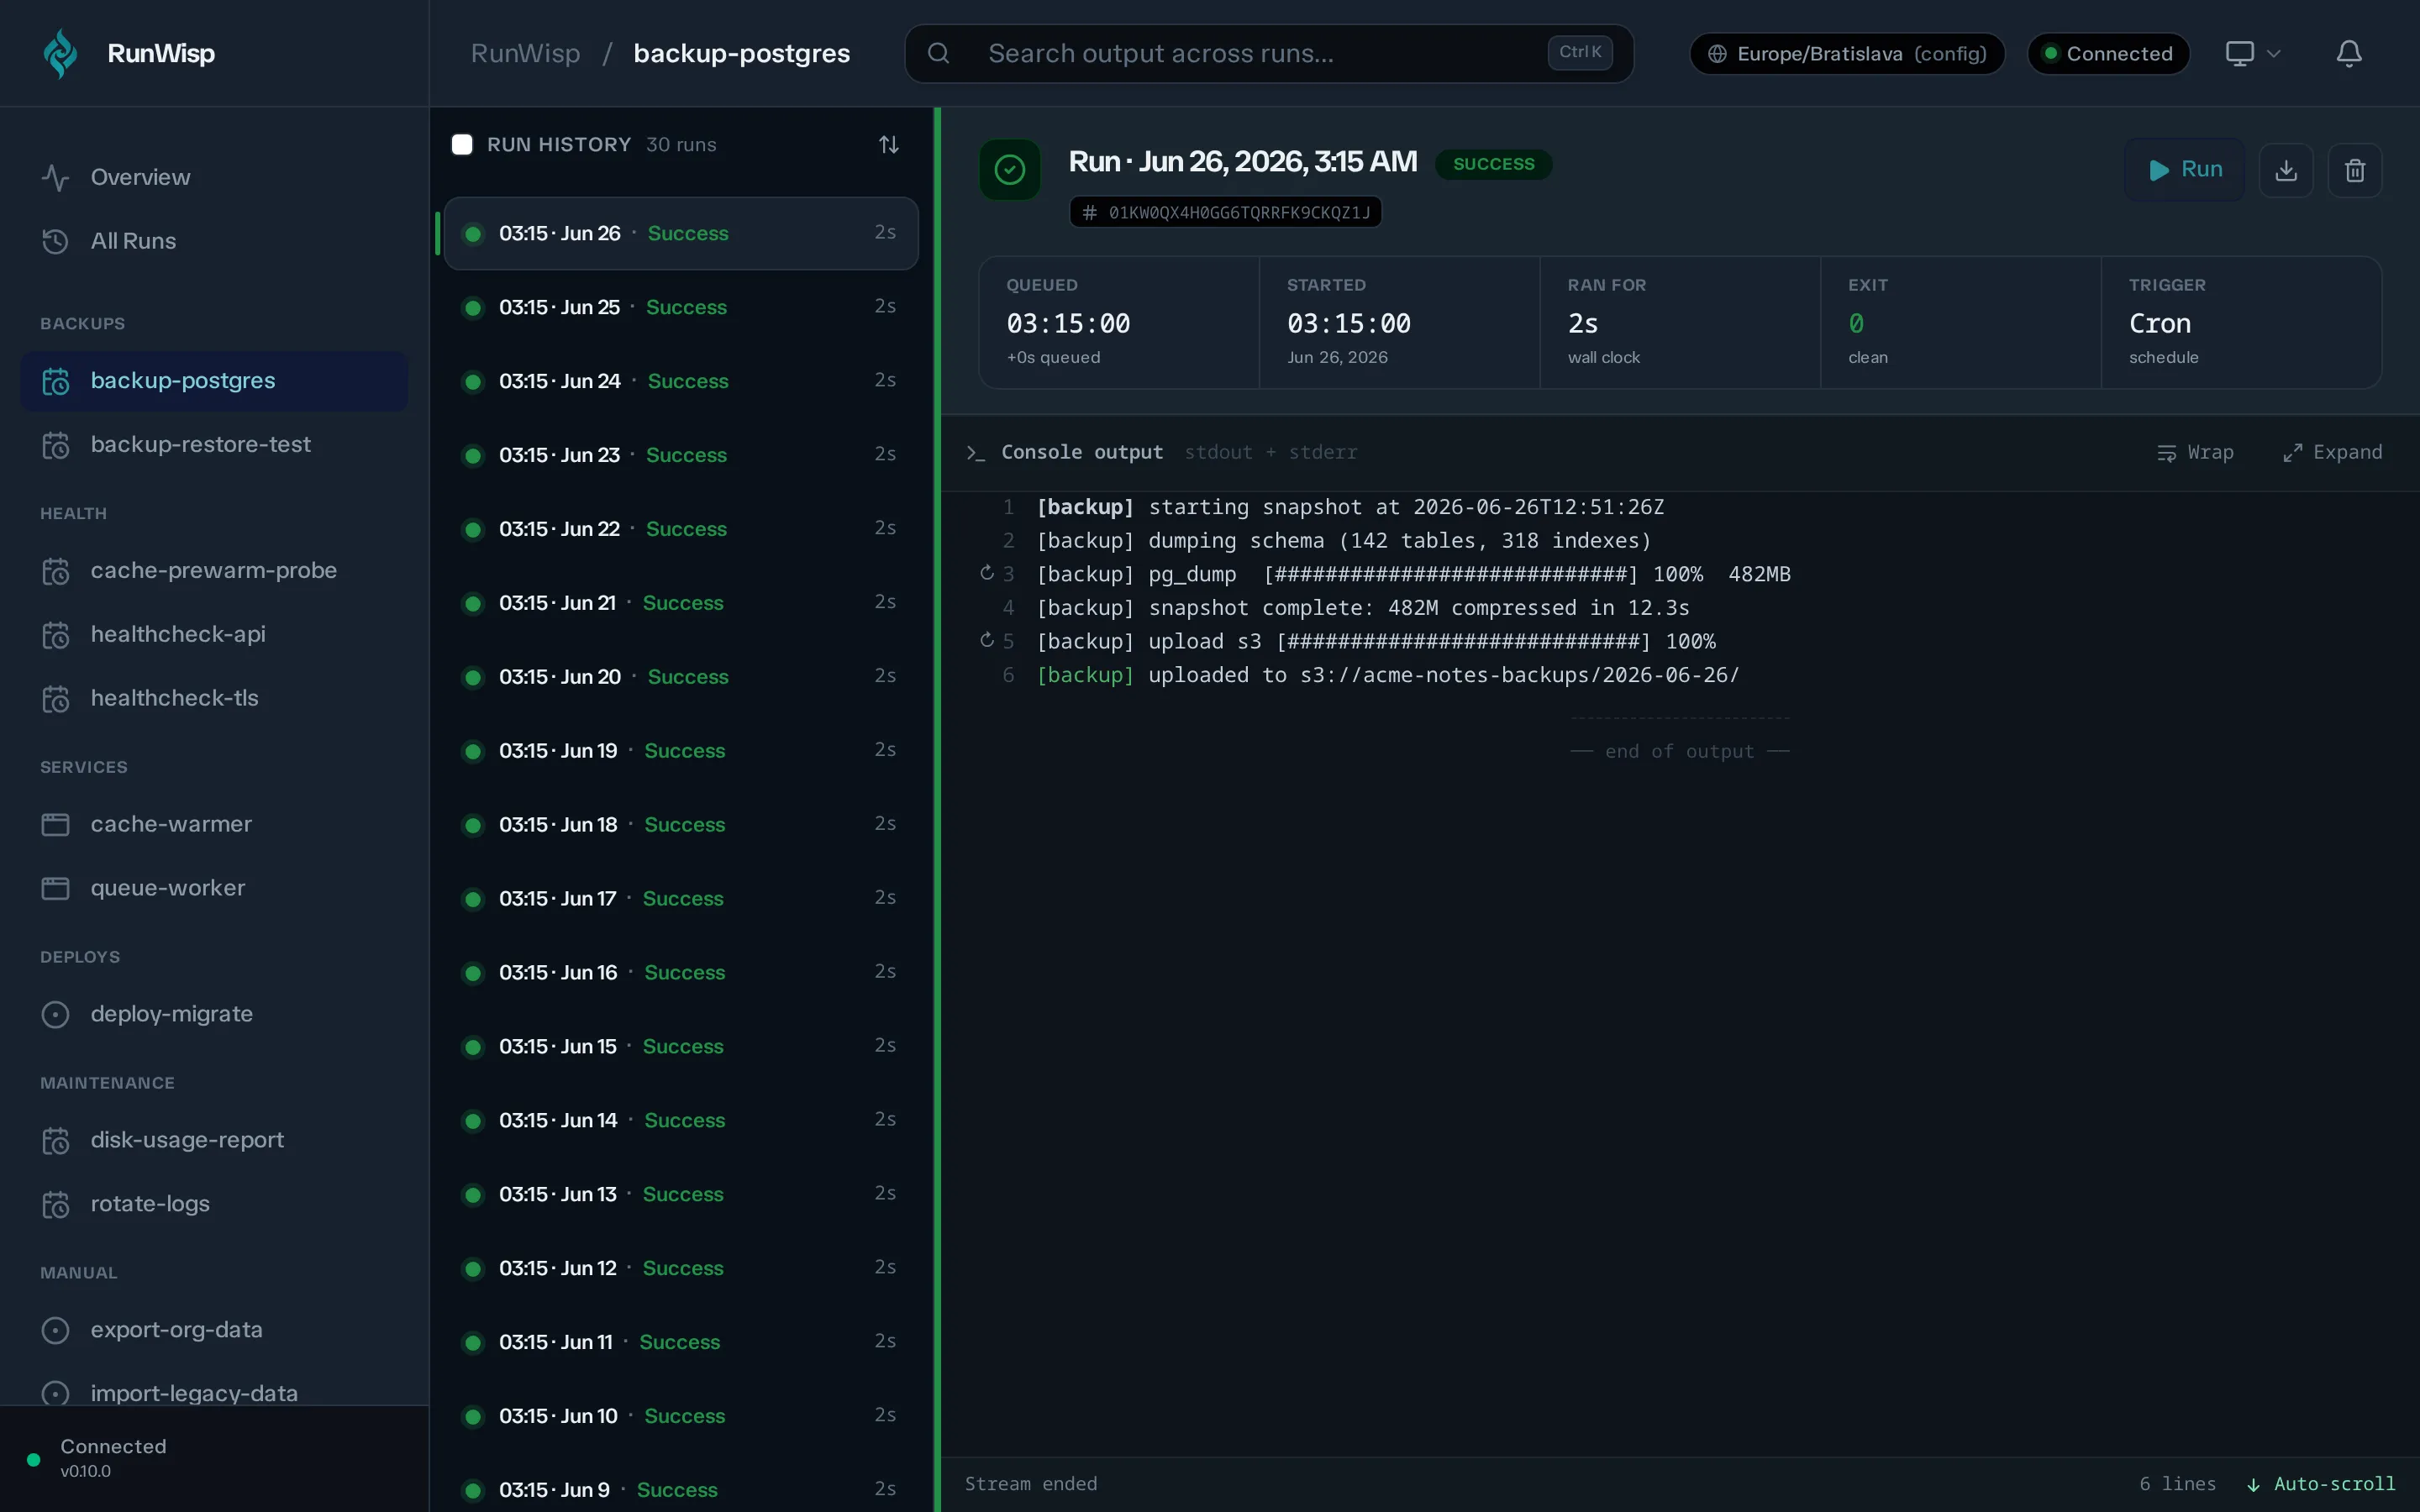
The log viewer
Section titled “The log viewer”When you open a finished run, the log viewer opens at the end of the log and loads earlier content as you scroll up. For a run still in progress, new lines stream in live. Line numbers match exactly, so anything you grep for in the file on disk is at the same line number in the browser. A Download log button in the run header gives you the whole file as a single download.
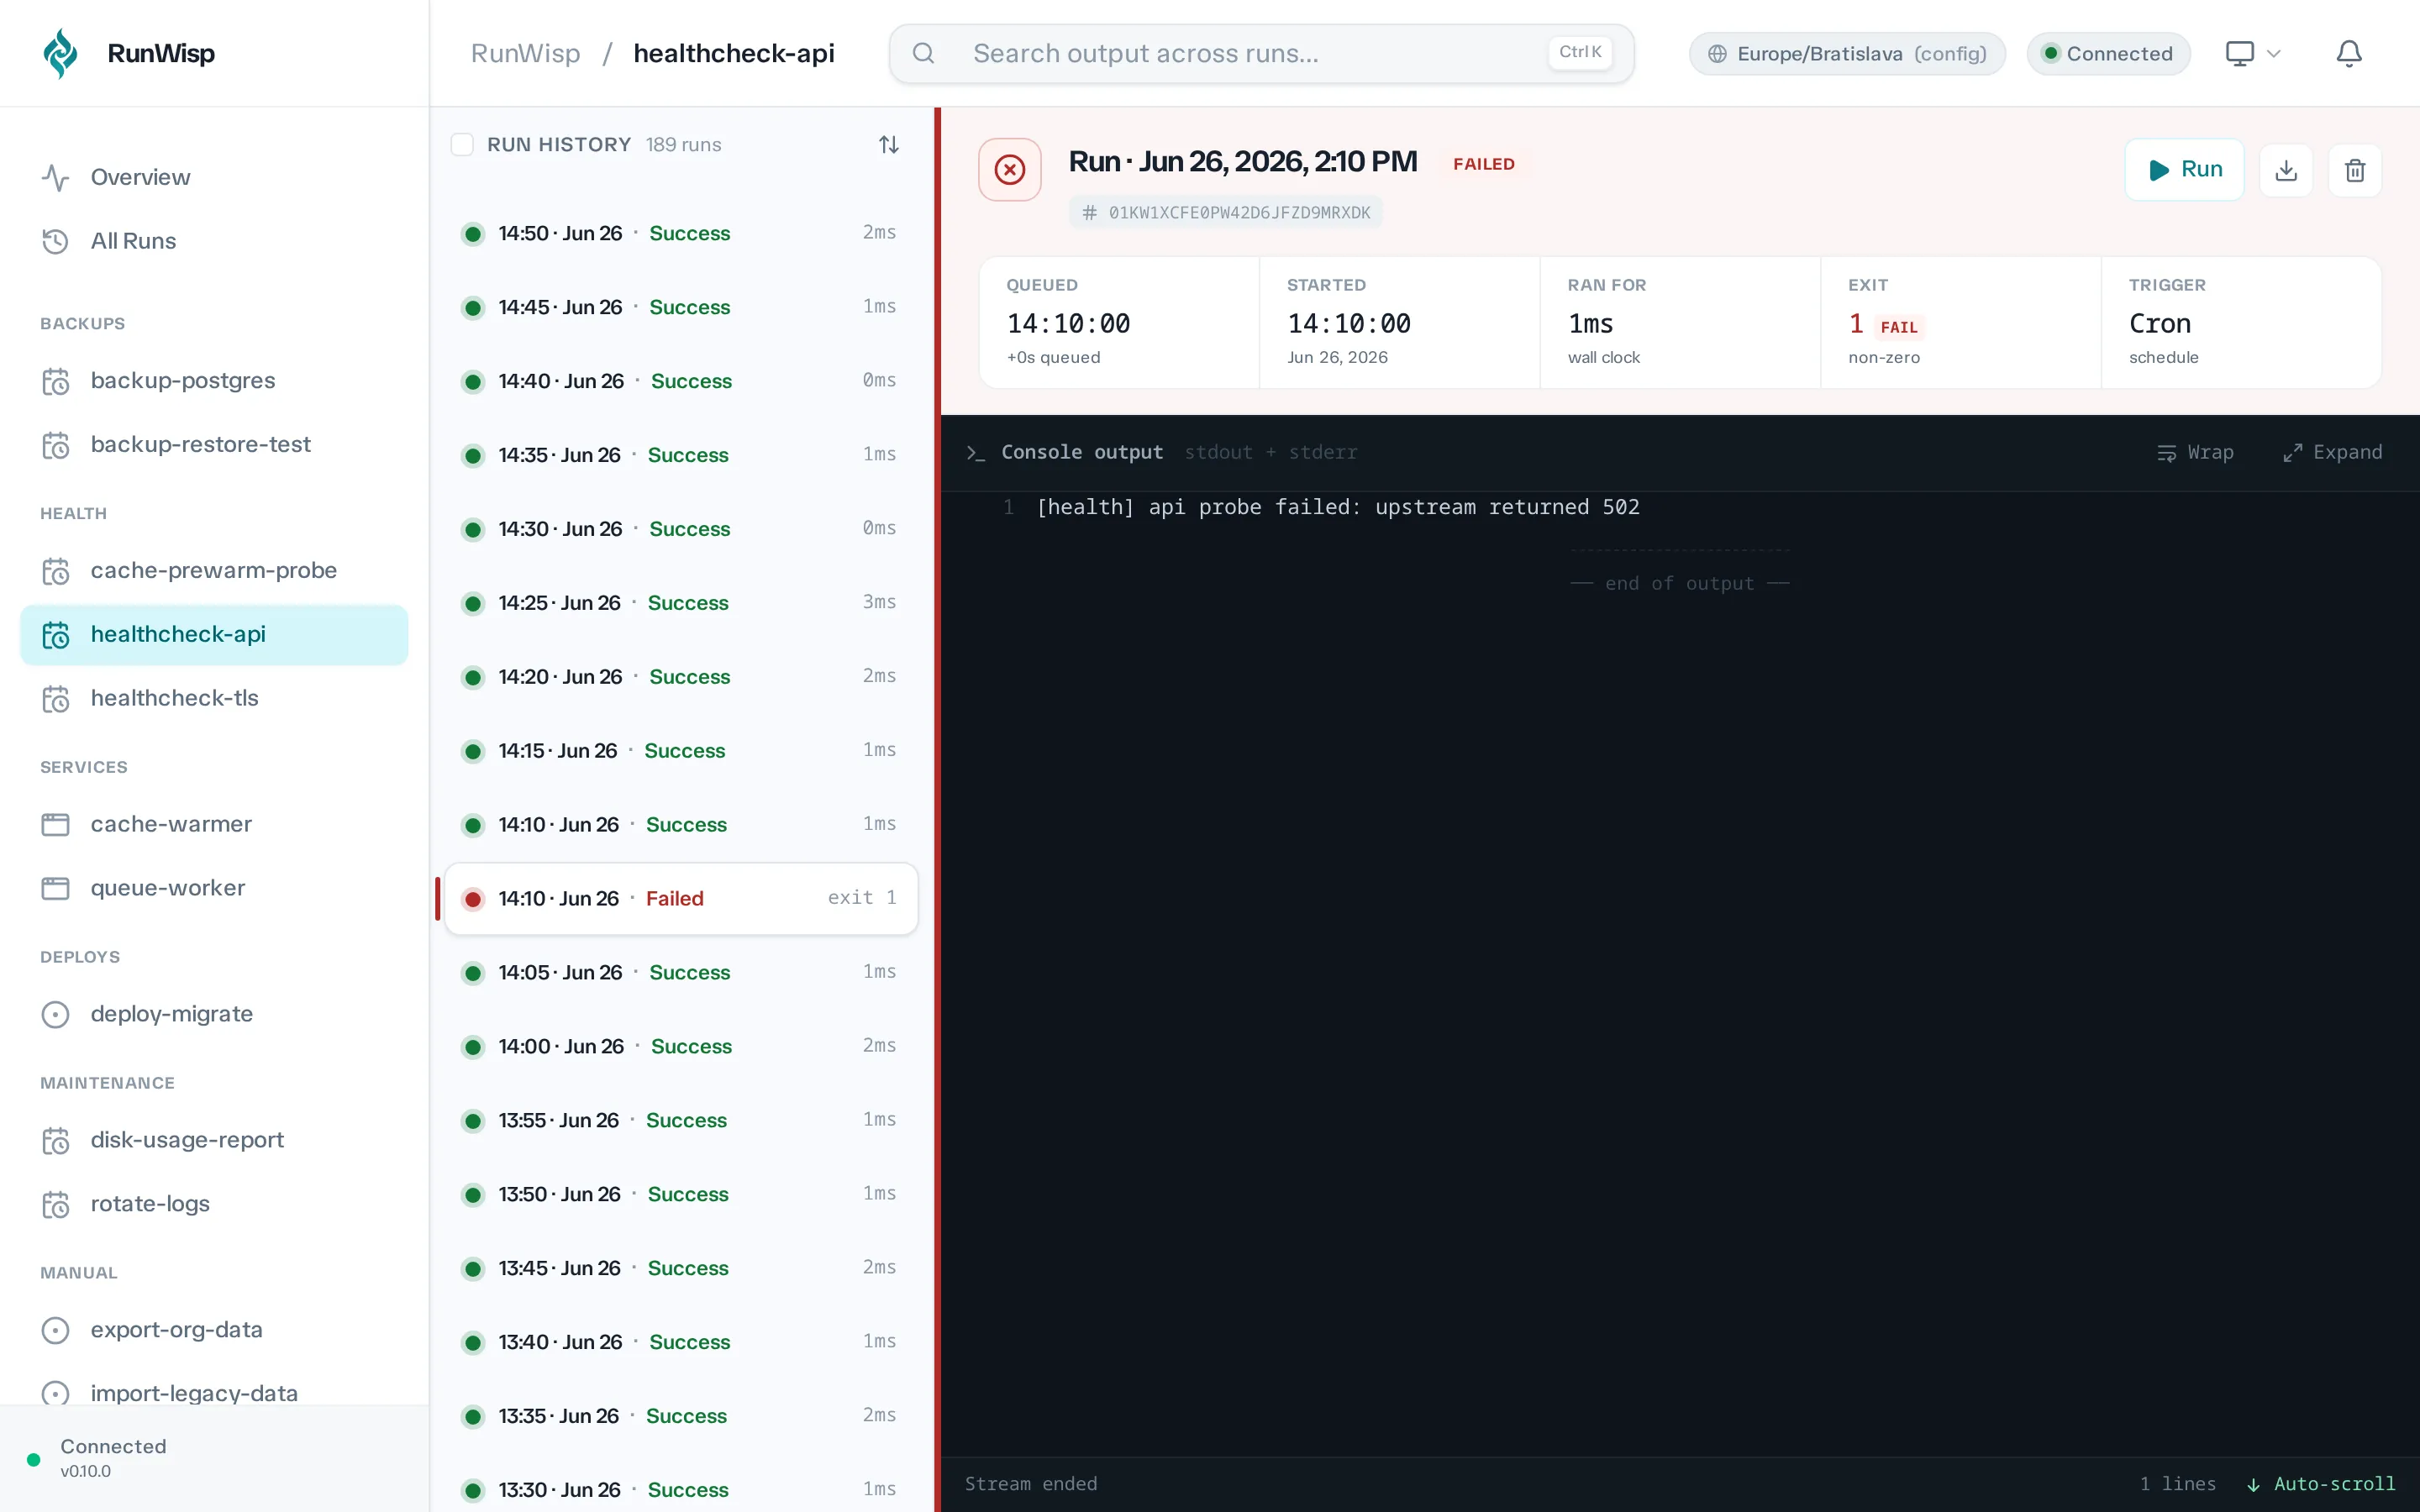
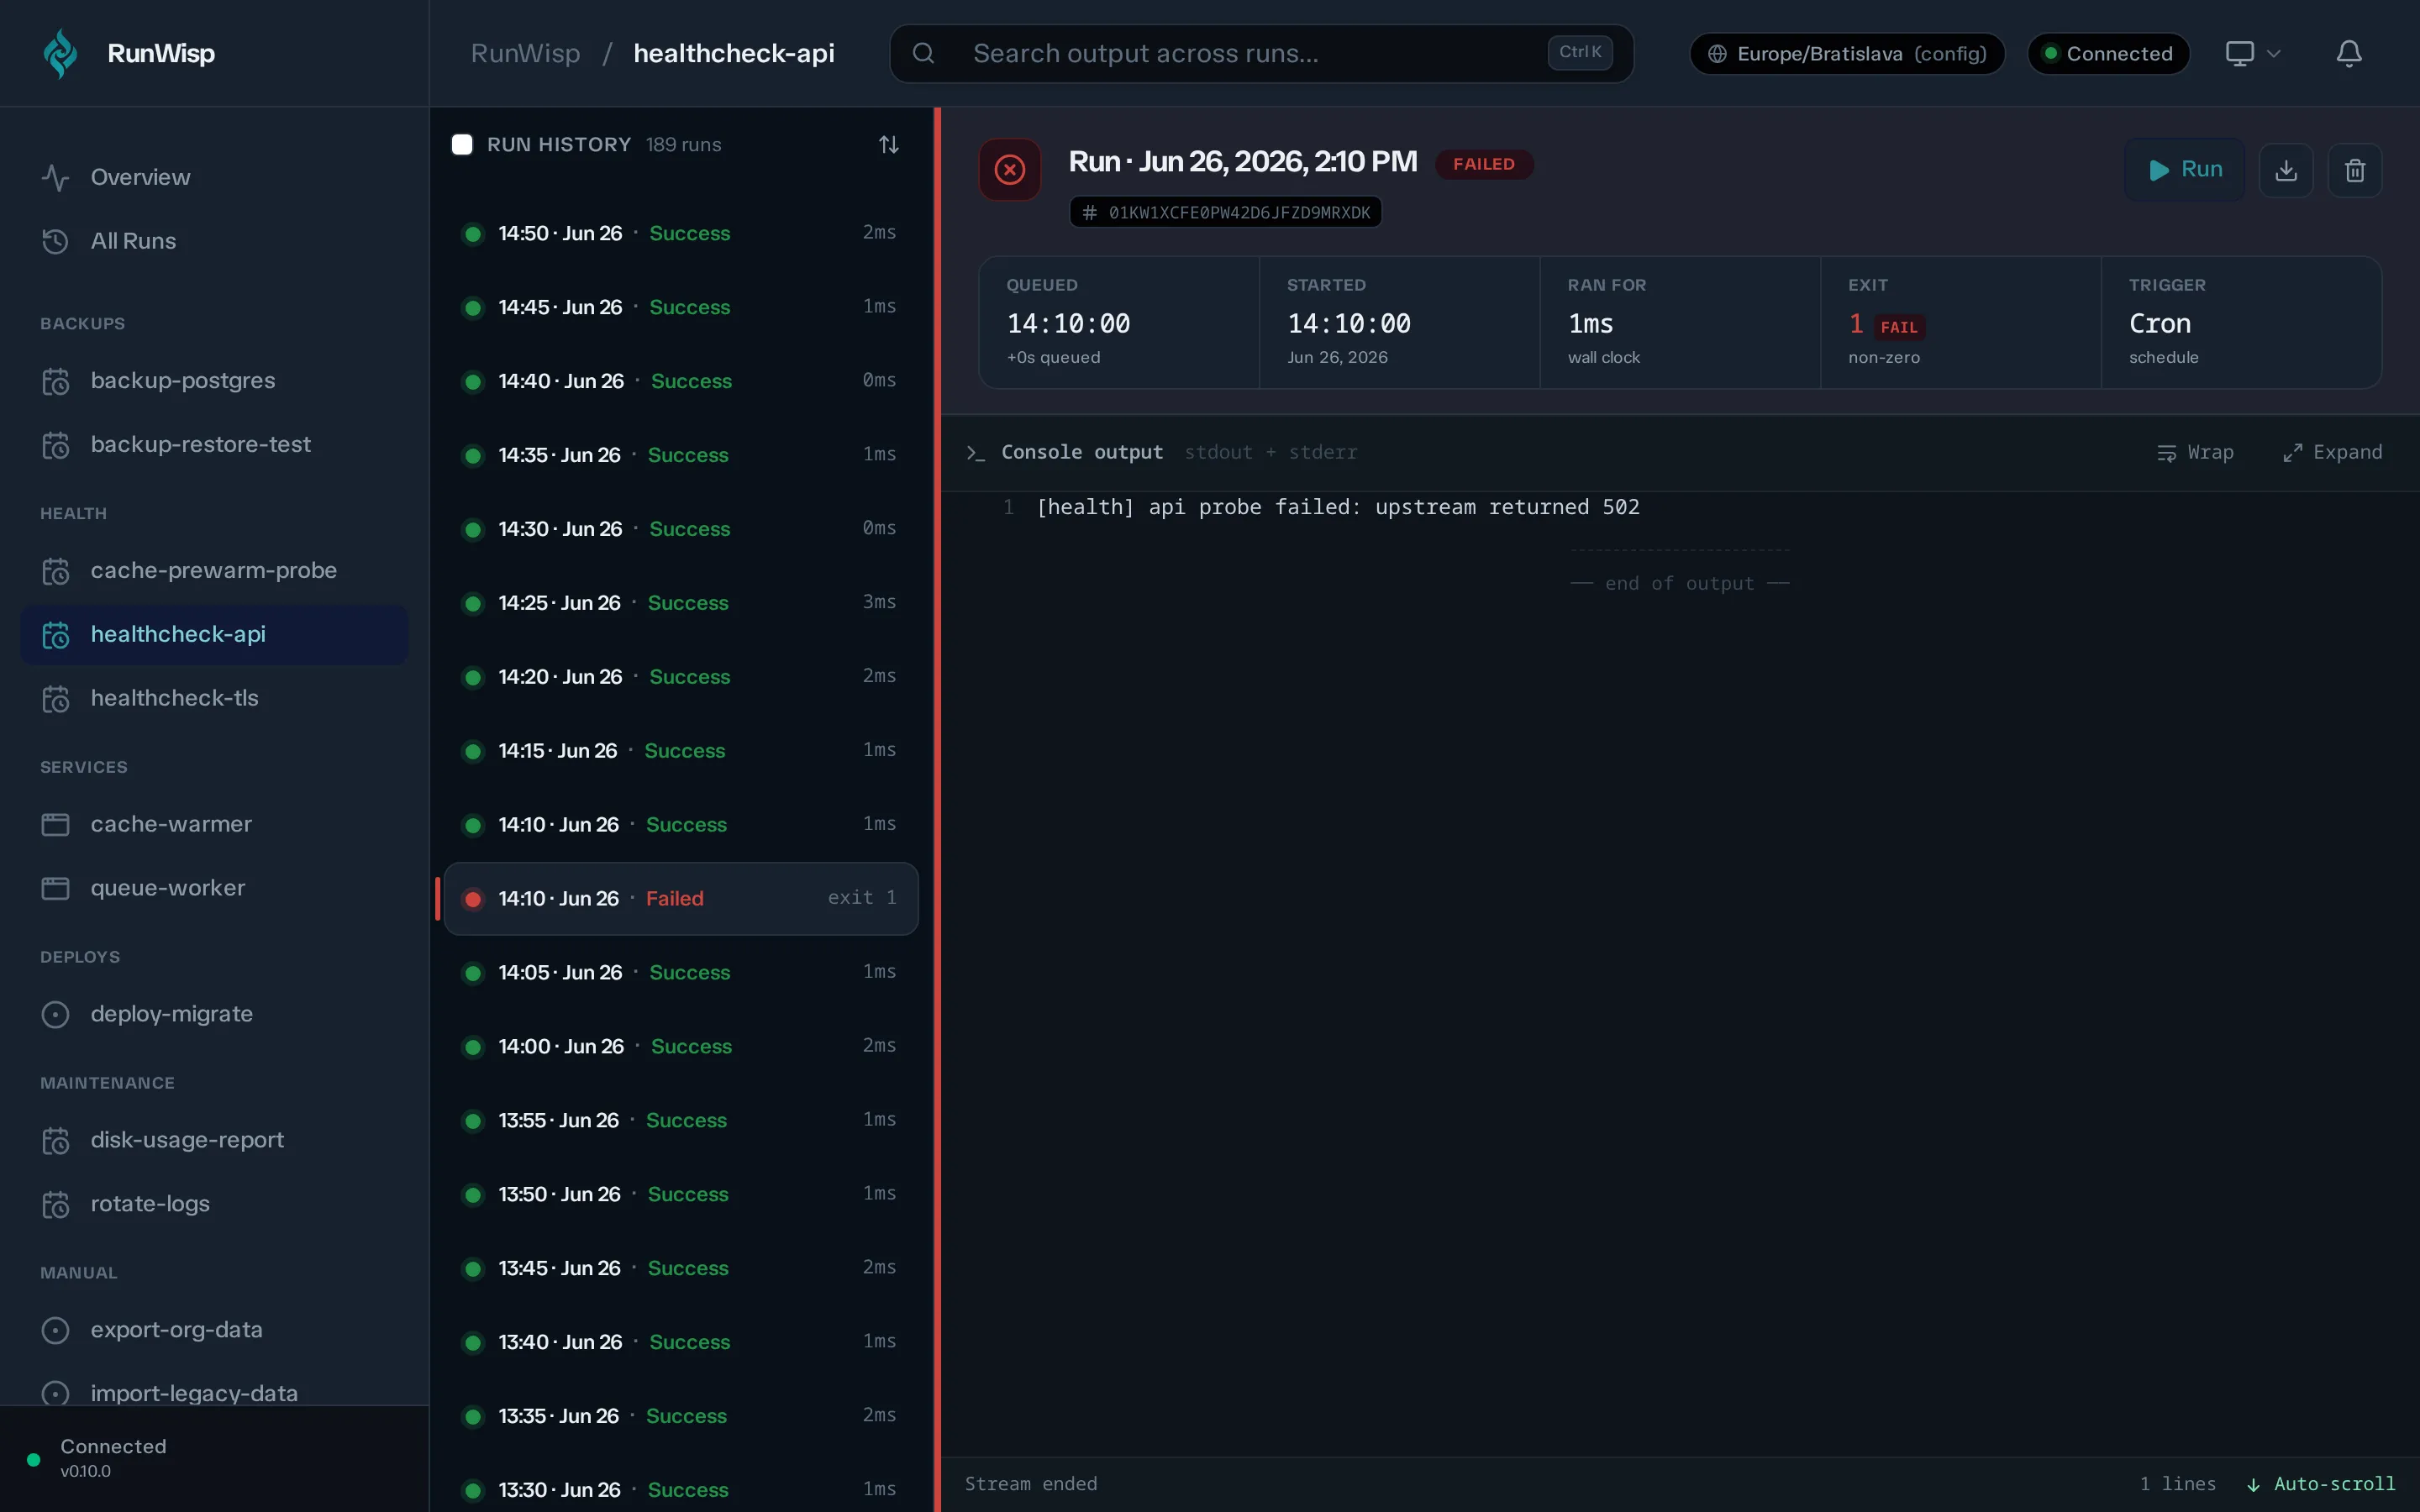
Failed runs
Section titled “Failed runs”Nothing silently fails. A failed run shows up in the same run history
as a successful one, marked with a coloured status pill — failed,
timeout, crashed, stopped, skipped, or log_overflow —
alongside its exit code and duration. Click the row to open the run,
and the captured stdout/stderr appears in the same log pane you’d
use for any other run. The Overview page’s Attention tab gathers
everything that isn’t currently healthy so you can spot trouble
without checking each task by hand.
Notifications bell
Section titled “Notifications bell”Top-right of the top bar. The badge shows your unread count.
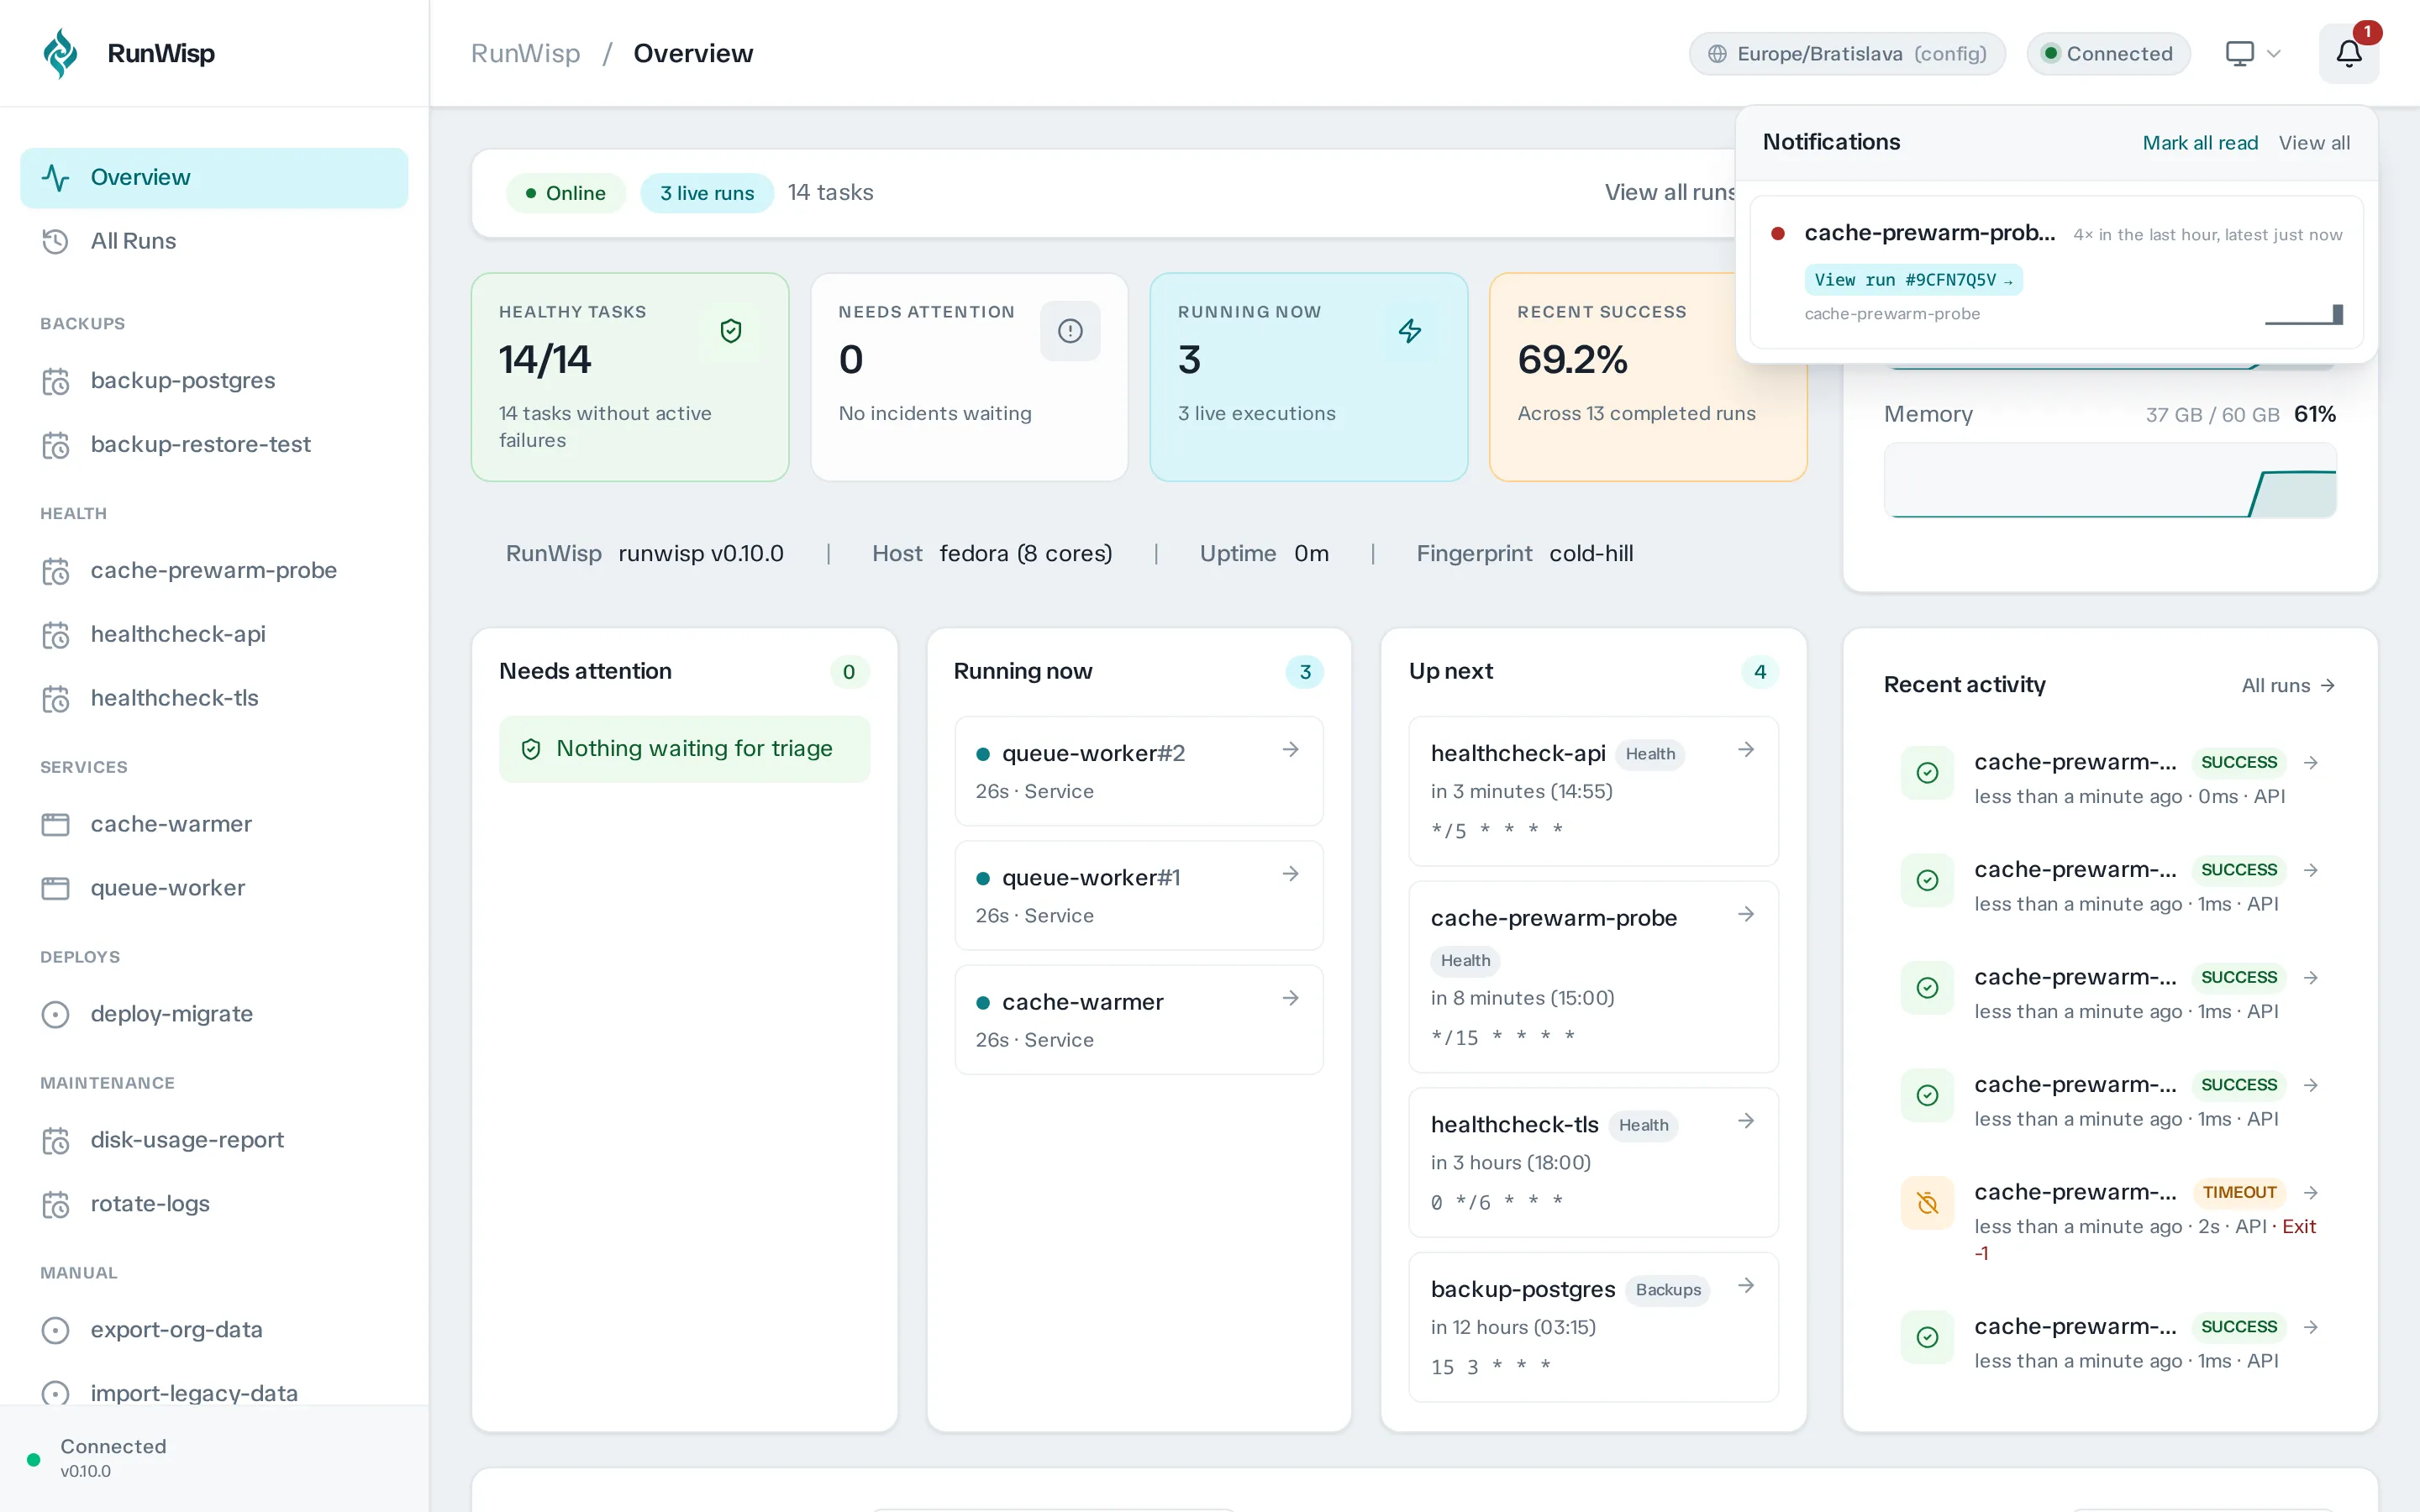
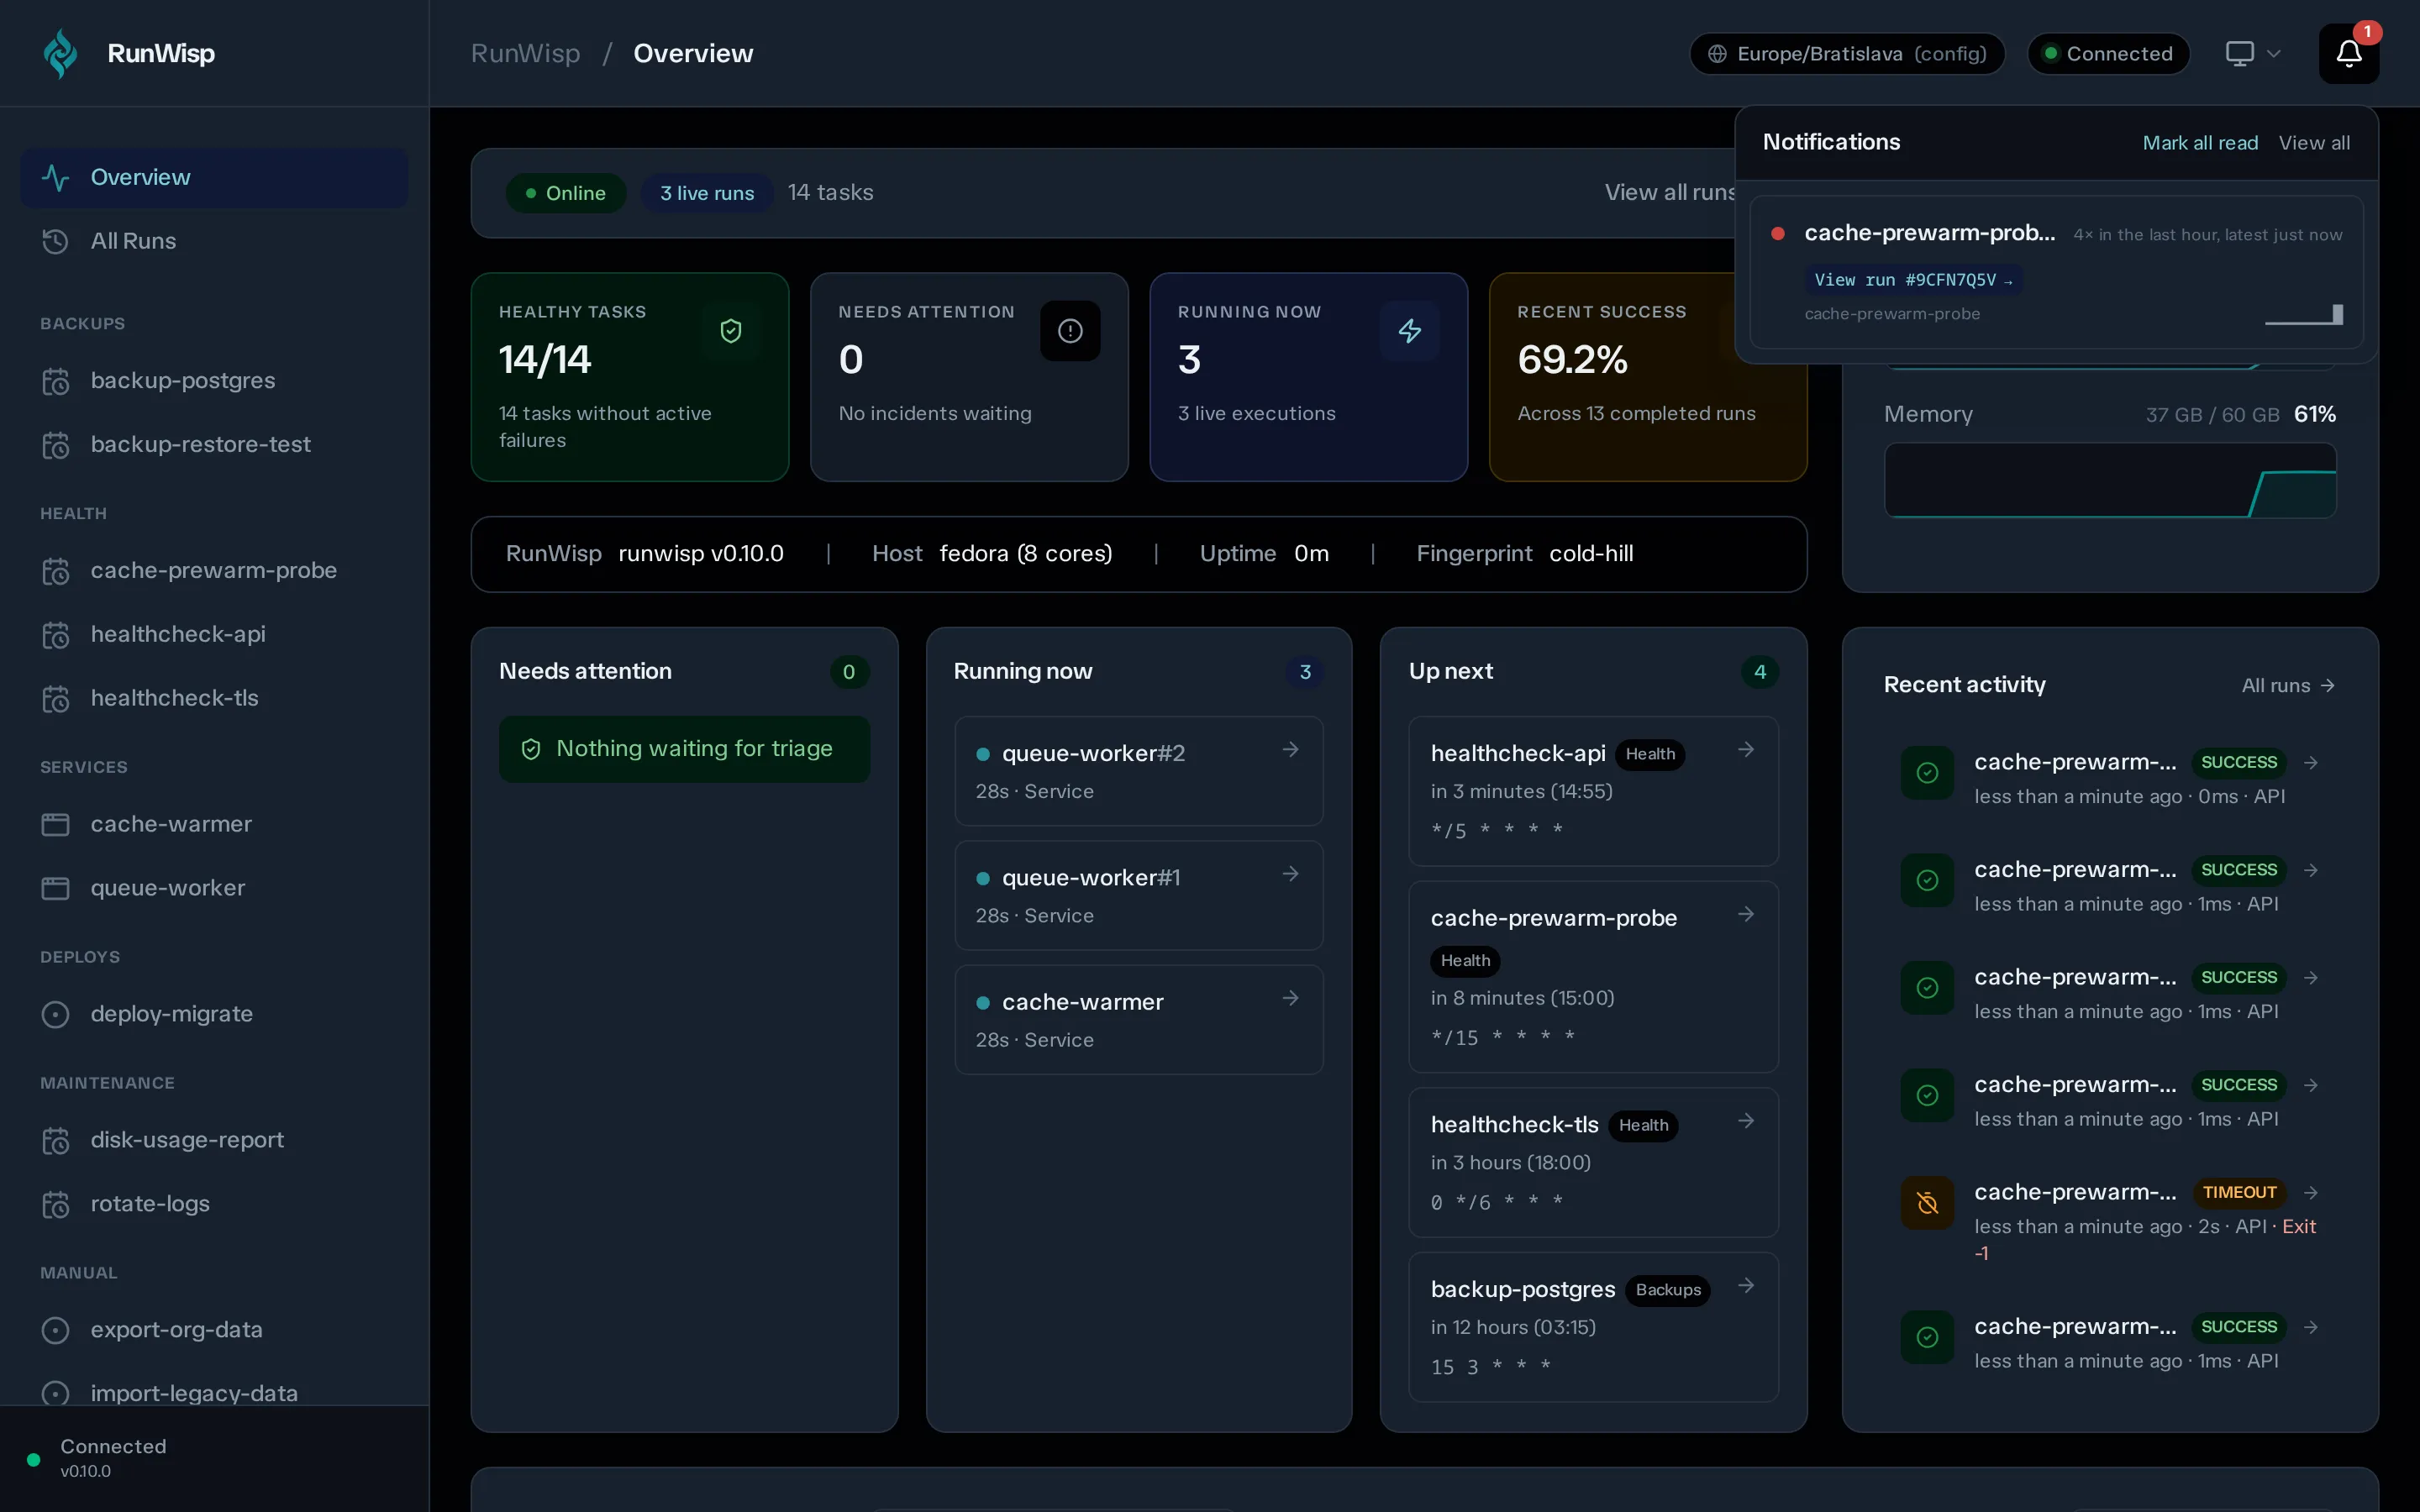
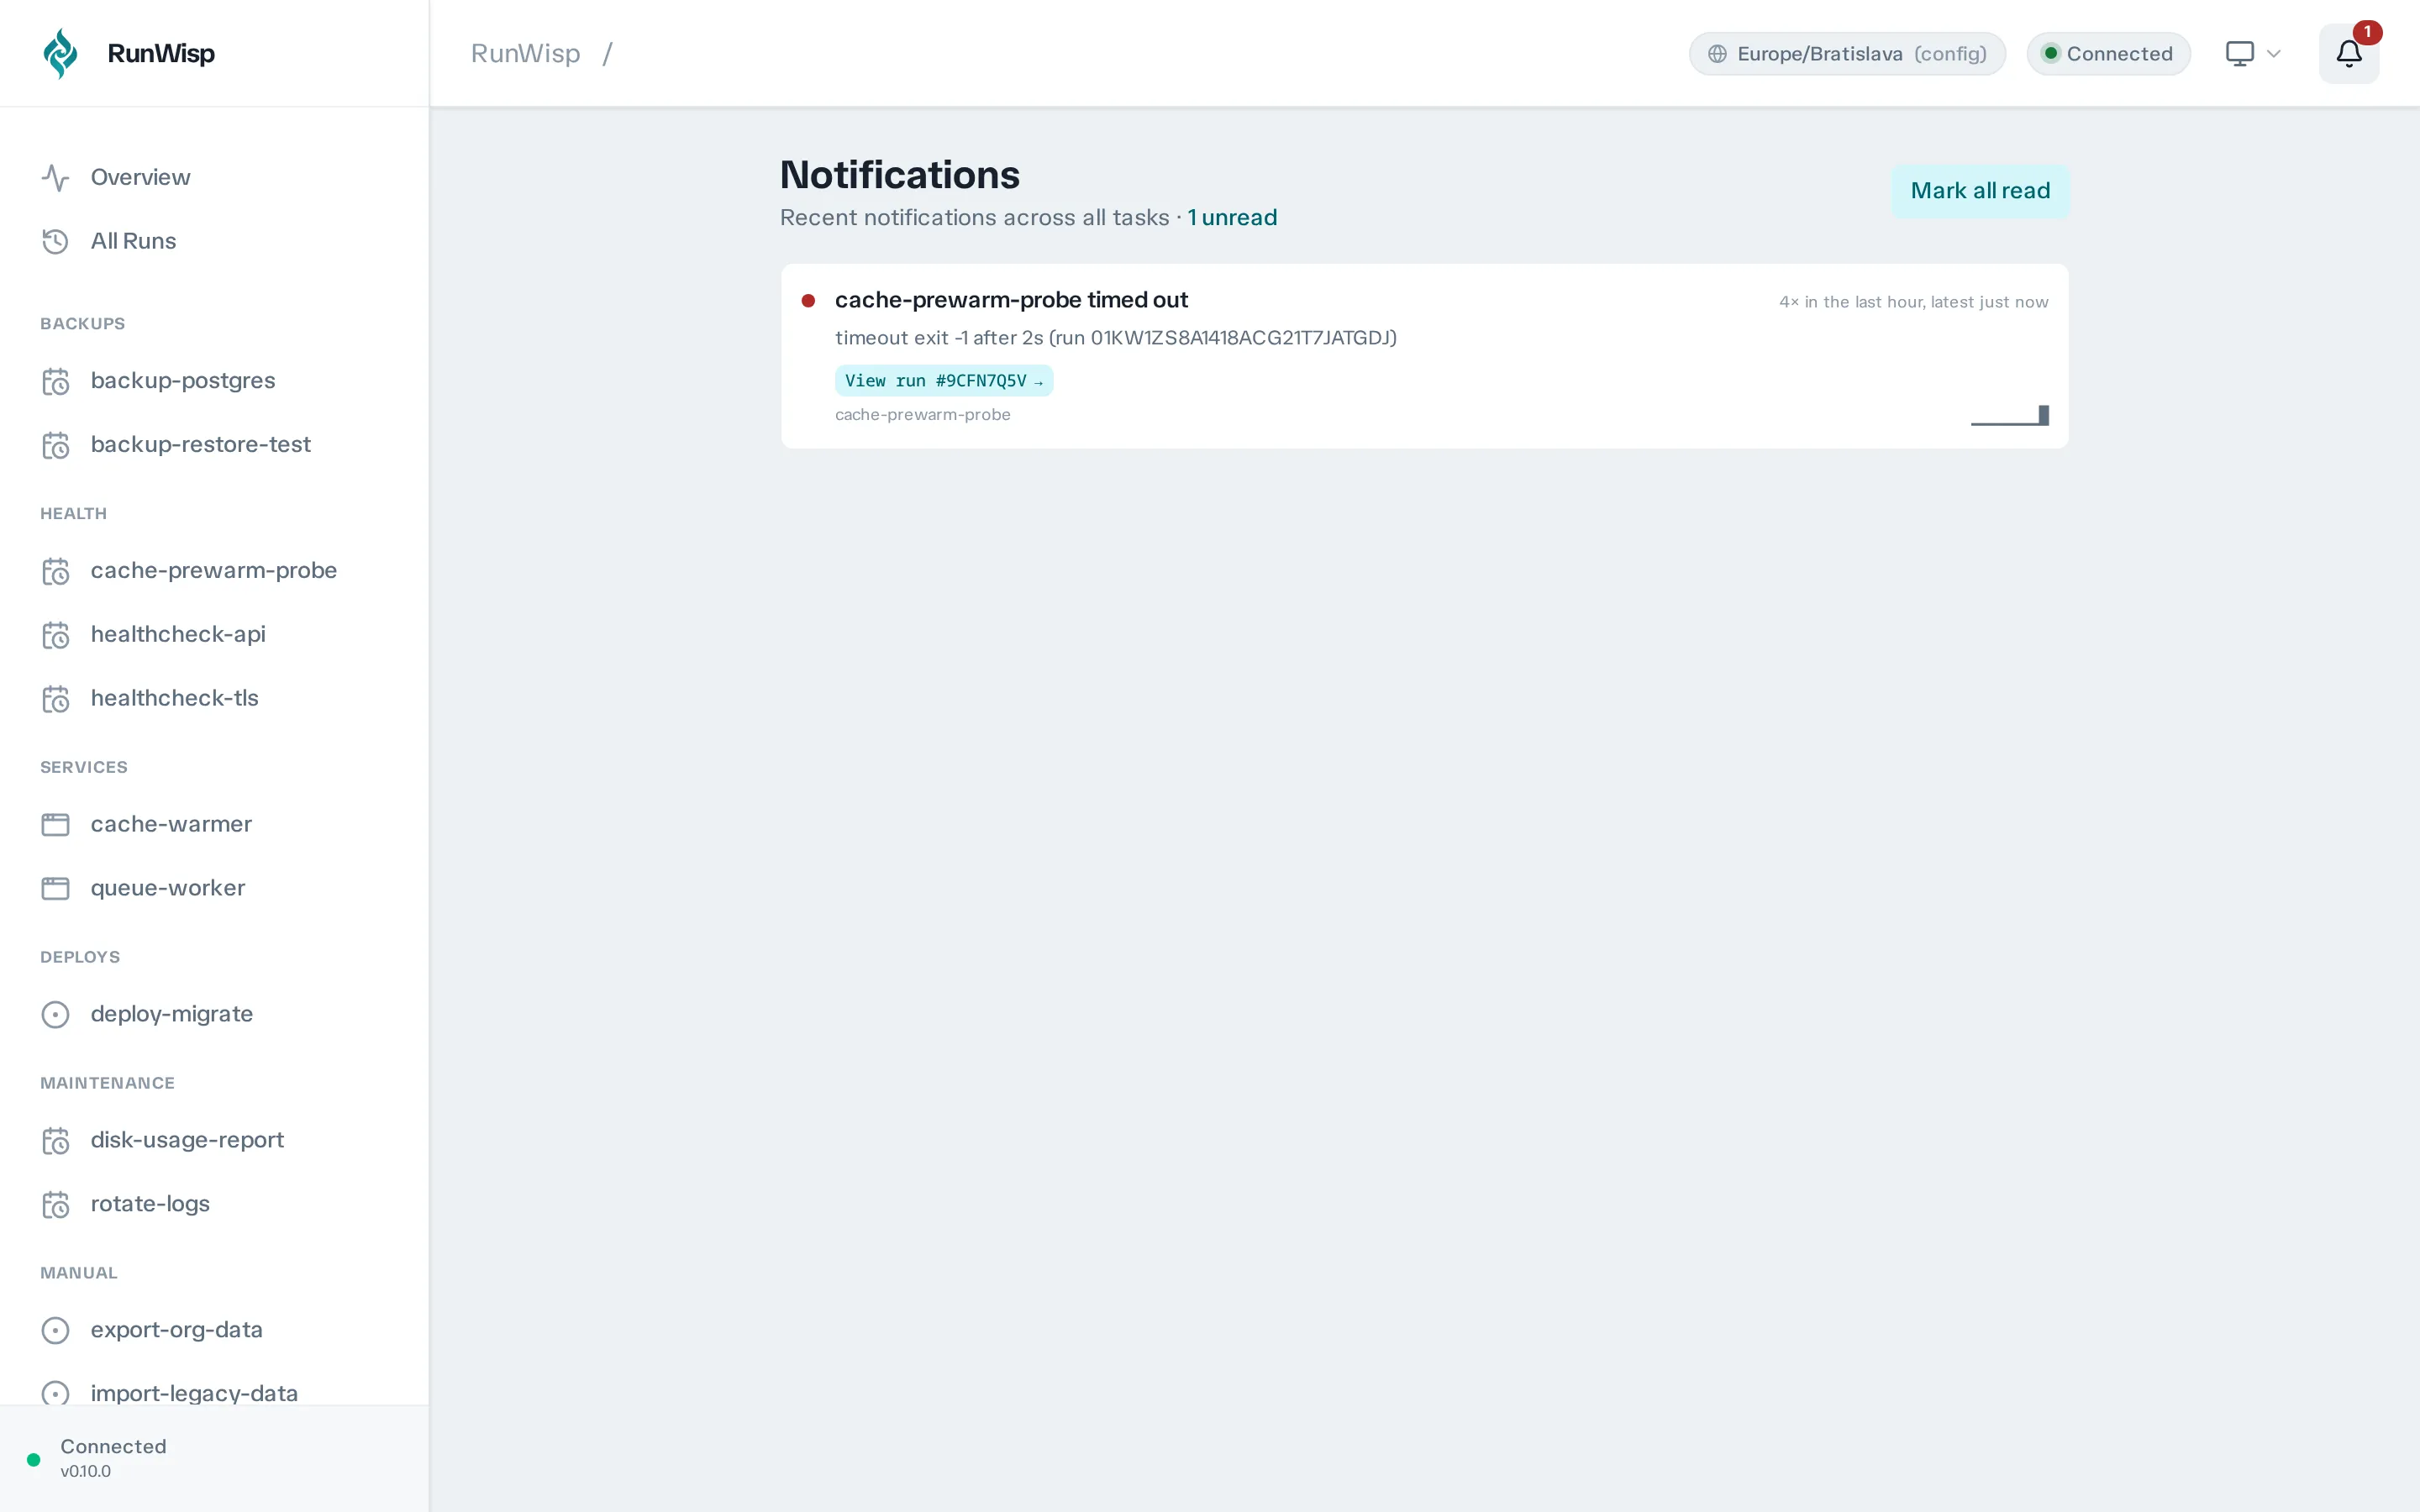
Click the bell to open a panel with recent notifications, a “View all” link, and a “Mark all read” button. Each row carries a severity dot, the event headline, when it happened, and the task name; grouped rows get a small sparkline showing the rhythm.
The notifications model groups duplicate events so a task that fails over and over doesn’t flood your bell — repeats collapse into one row with a short summary (“12× in the last hour, latest 30s ago”). Click a notification to open the run it’s about.
Full notifications page (/notifications)
Section titled “Full notifications page (/notifications)”The bell shows a preview. This page shows everything — paginated, with a “Load more” button. Same row layout, with the unread count at the top.
What it doesn’t do
Section titled “What it doesn’t do”The Web UI is for watching and controlling, not configuring. You can
trigger, stop, and restart, and you can see everything that’s going
on — but runwisp.toml is still the source of truth. To change what
the daemon does (add a task, tweak a schedule, rename a group, set up a
notifier, scale a service), edit the file and run
runwisp reload (or restart for daemon-wide
settings like [storage] or the scheduler timezone).